Table of Contents Show
") Experimental evidence of neutrinos produced in the CNO fusion cycle in the Sun
Experimental evidence of neutrinos produced in the CNO fusion cycle in the Sun
Nature volume 587, pages 577-582 (2020)
Published 25 November 2020 (cover story)
[doi:10.1038/s41586-020-2934-0] (full text here)Abstract
News coverage
- Perché le stelle brillano? Giovedì 3 dicembre alle 14:00 approfondimento in diretta degli ultimi risultati dell’esperimento Borexino, installato presso i Laboratori Nazionali Del Gran Sasso – INFN, con:
- Ezio Previtali, direttore LNGS
- Marco Pallavicini, co-responsabile Borexino e giunta INFN
- Barbara Caccianiga, professoressa a Università degli Studi di Milano e ricercatrice INFN Borexino
- Modera Matteo Massicci, Ufficio Comunicazione INFN.
- Coverage from international scientific institutions:
- APPEC (UE): “Borexino performs the first detection ever of CNO cycle neutrinos from the Sun”
- FZJ Jülich (DE), press release: “A Missing Piece of the Puzzle for the Solar Engine”
- EurekAlert! (USA): “Solar CNO neutrinos observed for the first time”
- INAF (IT): “Borexino: così brillano le stelle massive”
- LNGS (IT): “BOREXINO ottiene la prima prova sperimentale di come brillano le stelle massive” (click on the flag for English version)
- JINR (RU)First Experimental Proof of Theorized Nuclear Fusion Processes in Massive Stars
- RWTH Aachen University (DE): “Hidden Processes in the Center of the Sun Uncovered”
- SINP MSU (RU): “Новые результаты проекта Borexino”(Russian)
- International media coverage:
- Canada News Media (CA): “Scientists find neutrinos from star fusion for the first time” (repost from “Engadget”)
- cnBeta (CN): “意大利Borexino研究团队证实太阳在CNO聚变循环中产生了中微子”
- The Independent (UK): “Scientists make major breakthrough in finding out why the sun shines”
- NBC news (USA): “For the first time, scientists detect the ghostly signal that reveals the engine of the universe”
- NZZ (CH): “Astrophysicists take a deep look into the sun – and are richly rewarded”
- Qbit (HU): “Igazolták a csillagok egyik fő fúziós folyamatának létezését”
- RIA Novostii (RU): “Впервые зафиксированы нейтрино вторичного термоядерного цикла Солнца”
- Science AAAS (USA): “Borexino Awash in Neutrinos”
- ScienceDaily (USA): “Neutrinos yield first experimental evidence of catalyzed fusion dominant in many stars”
- Italian media coverage:
- Adnkronos: “Sole e stelle, svelato il mistero: ecco come brillano”
- ANSA: “Dai neutrini i segreti che fanno brillare le stelle”
- Corriere della Sera: “Brillano senza collassare: dopo 30 anni scoperto il segreto delle stelle giganti”
- Il Messaggero: “Laboratori del Gran Sasso, Borexino svela i misteri del Sole”
- Il Fatto Quotidiano: “Svelato il motore che accende le stelle, “per la prima volta sappiamo come e perché brillano””
- Le Scienze: “Da Borexino la conferma sperimentale di come brillano le stelle massicce”
- Repubblica: “Hanno trovato il motore che accende le stelle nell’universo”
- Previuos coverage after the first announcement at the “Neutrino 2020” conference:
- Nature news: Neutrinos reveal final secret of Sun’s nuclear fusion
- CERN Courier: “A highlight of the conference was the first observation of solar CNO neutrinos”
- 中国科学报 (CN) “中微子研究揭示太阳核聚变缺失环节”
- Phys.org: “CNO fusion neutrinos from the sun observed for the first time”
- Le Scienze (IT): “Il gran finale di Borexino alla ricerca dei segreti del Sole”
- Symmetry magazine (USA): “Unraveling the processes that power the sun”
- TechNews (TW) “首次直接檢測太陽核心產生的微中子,將幫助洞悉太陽核心結構”
Open Data
In November 2020, the Borexino Collaboration publishes [Nature volume 587, 577–582 (2020)] the first experimental evidence of neutrinos produced in the carbon-nitrogen-oxygen (CNO) fusion cycle in the Sun.
For most of their lifetime, stars are fuelled through fusion of hydrogen into helium via two processes: the pp chain and the CNO cycle. While the pp-chain is dominant in stars as massive as our Sun, the CNO is the fundamental energy-producing process in bigger stars.
In 2018 the Borexino collaboration was already able to perform a complete spectroscopy of neutrinos from the pp chain. We now report the first experimental evidence of CNO neutrinos, obtained with such an unprecedentedly radio-pure, thermally stable, large volume liquid scintillator detector as Borexino.
The Borexino collaboration was able to measure the CNO solar neutrino interaction rate to be:  counts per day per 100 tonnes (t) of target at 68% C.L.
This corresponds to a flux of CNO neutrinos on Earth of  assuming the Mikheyev Smirnov Wolfenstein – Large Mixing Angle conversion in matter, neutrino oscillation parameters from F. Capozzi et al. (2018) , and a density of electrons in the scintillator of
  per 100 t.
The absence of CNO signal is thus disfavoured at 5 .
.
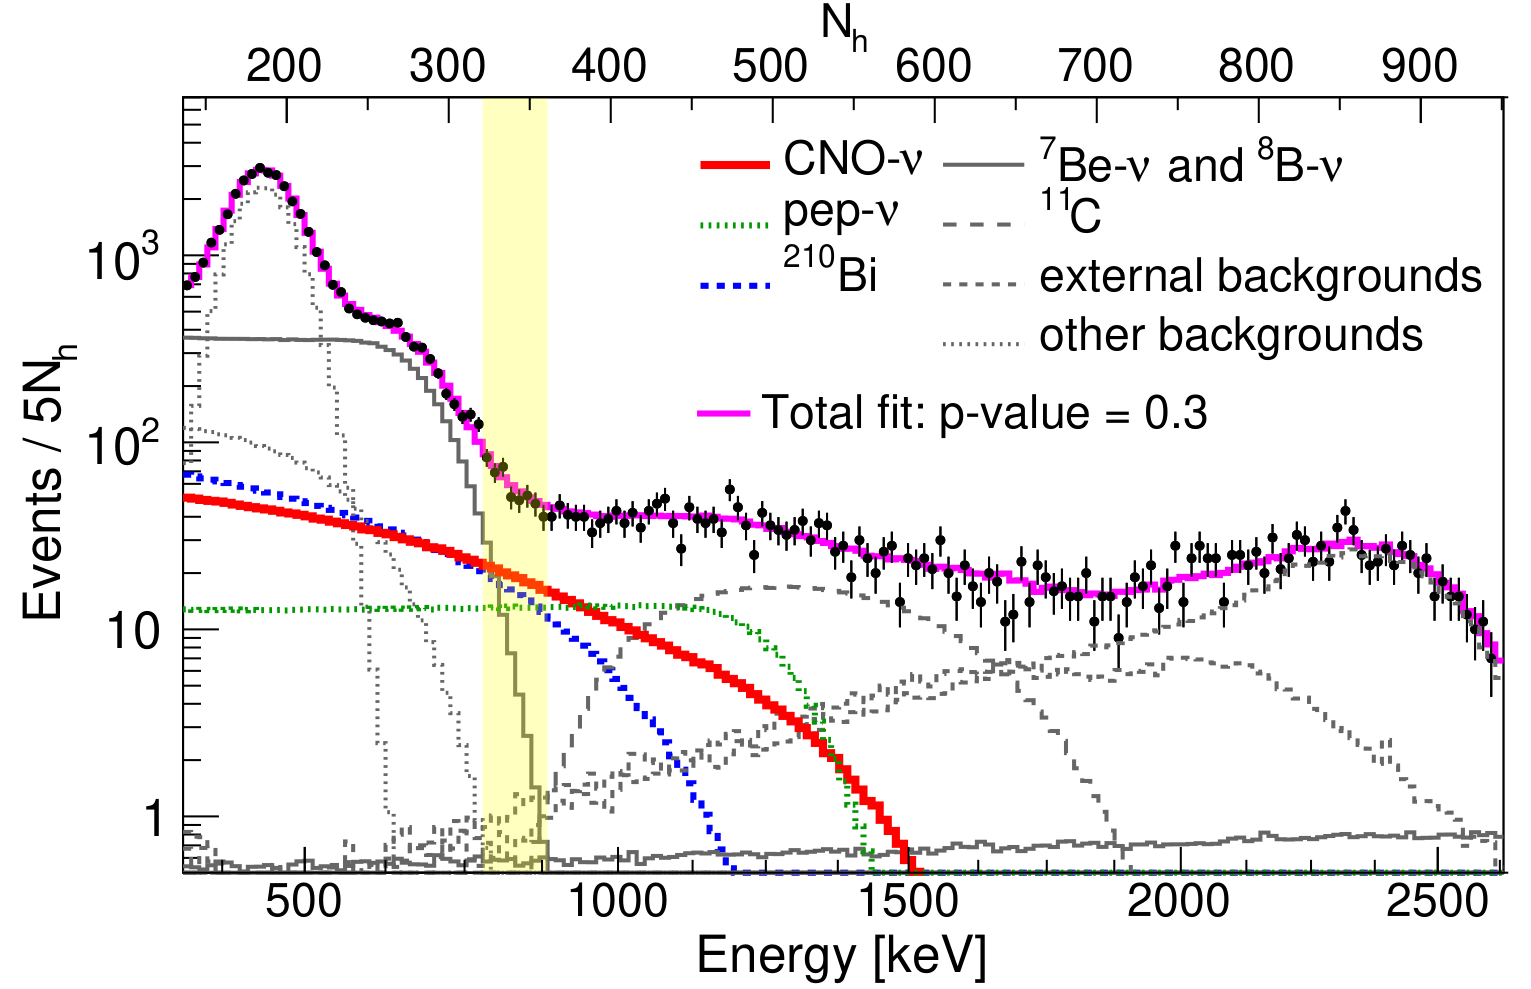
In this plot (Figure 2 of our Nature publication), we report the spectral fit of the Borexino data. The energy estimator  represents the number of photoelectrons detected by photomultipliers, normalized to 2,000 live channels. For sake of completeness, we also report the correspondent keV energy scale.
The distribution of the electron recoil energy scattered by solar neutrinos in the Borexino detector is defined by black points (properties of the data bins available here). CNO-neutrinos,  Bi and pep-neutrinos are highlighted in solid red, dashed blue and dotted green, respectively, and all other components are in grey. The total spectral fit is depicted in magenta. The yellow band represents the region with the largest signal-to-background ratio for CNO-neutrinos.
The correlation matrix of this spectral fit is presented below and can be downloaded here.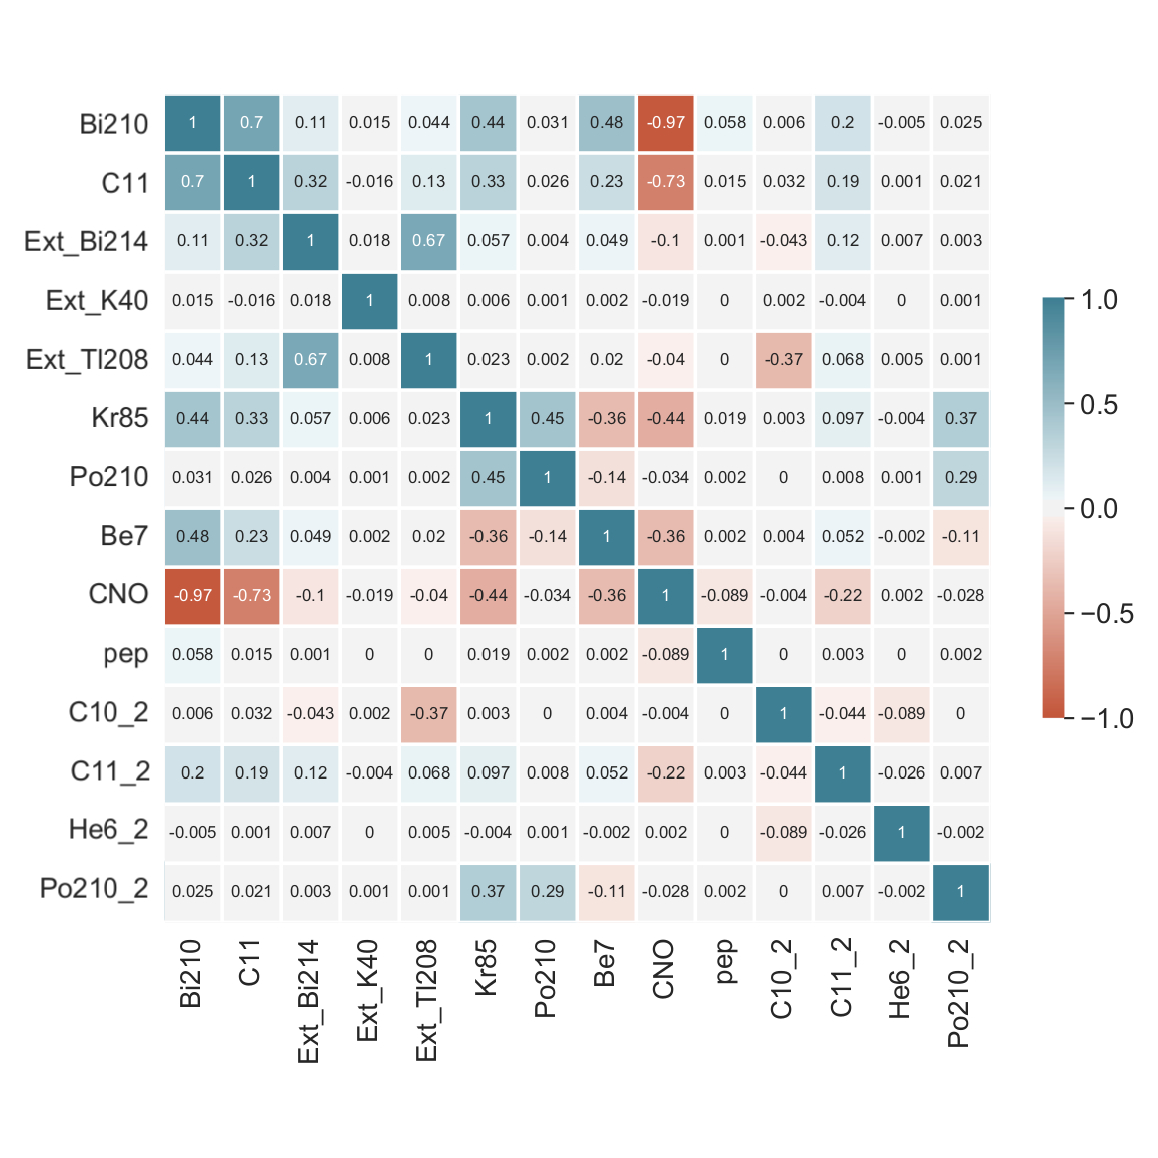
Figure 3 of our paper shows the spatial and temporal distribution of Po activity.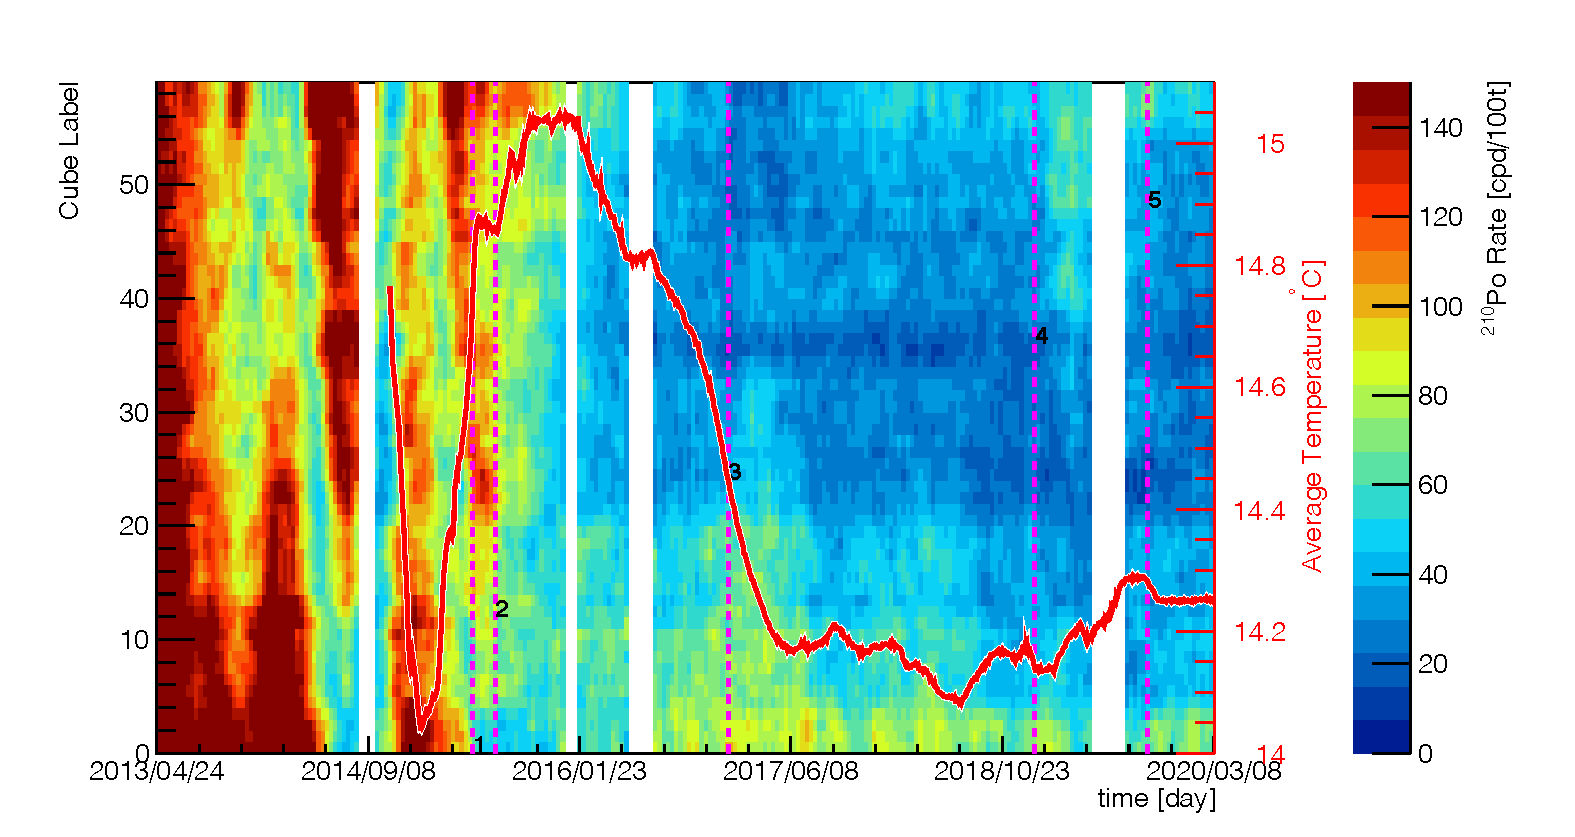
The Po rate in Borexino is given in cpd (counts per day) per 100 t (rainbow colour scale) as a function of time. Each small cube is of about 3 t and is ordered from the bottom (0) to the top (58) along the vertical direction.
All cubes are selected inside a sphere of radius r = 3 m. The red curve represents the average temperature in the innermost region surrounding the nylon vessel. The temperature profile can be downloaded (two separate files) here and here. The dashed vertical lines indicate the most important milestones of the temperature stabilization program: (1) the beginning of the Borexino insulation program; (2) the turning off of the water recirculation system in the water tank; (3) the first operation of the active temperature control system; (4) the change of the active control set point; (5) the installation and commissioning of the hall temperature control system.
The white vertical bands represent different interruptions of the Borexino data acquisition.
Figure 4 of our publication report the results of the CNO counting and spectral analyses.
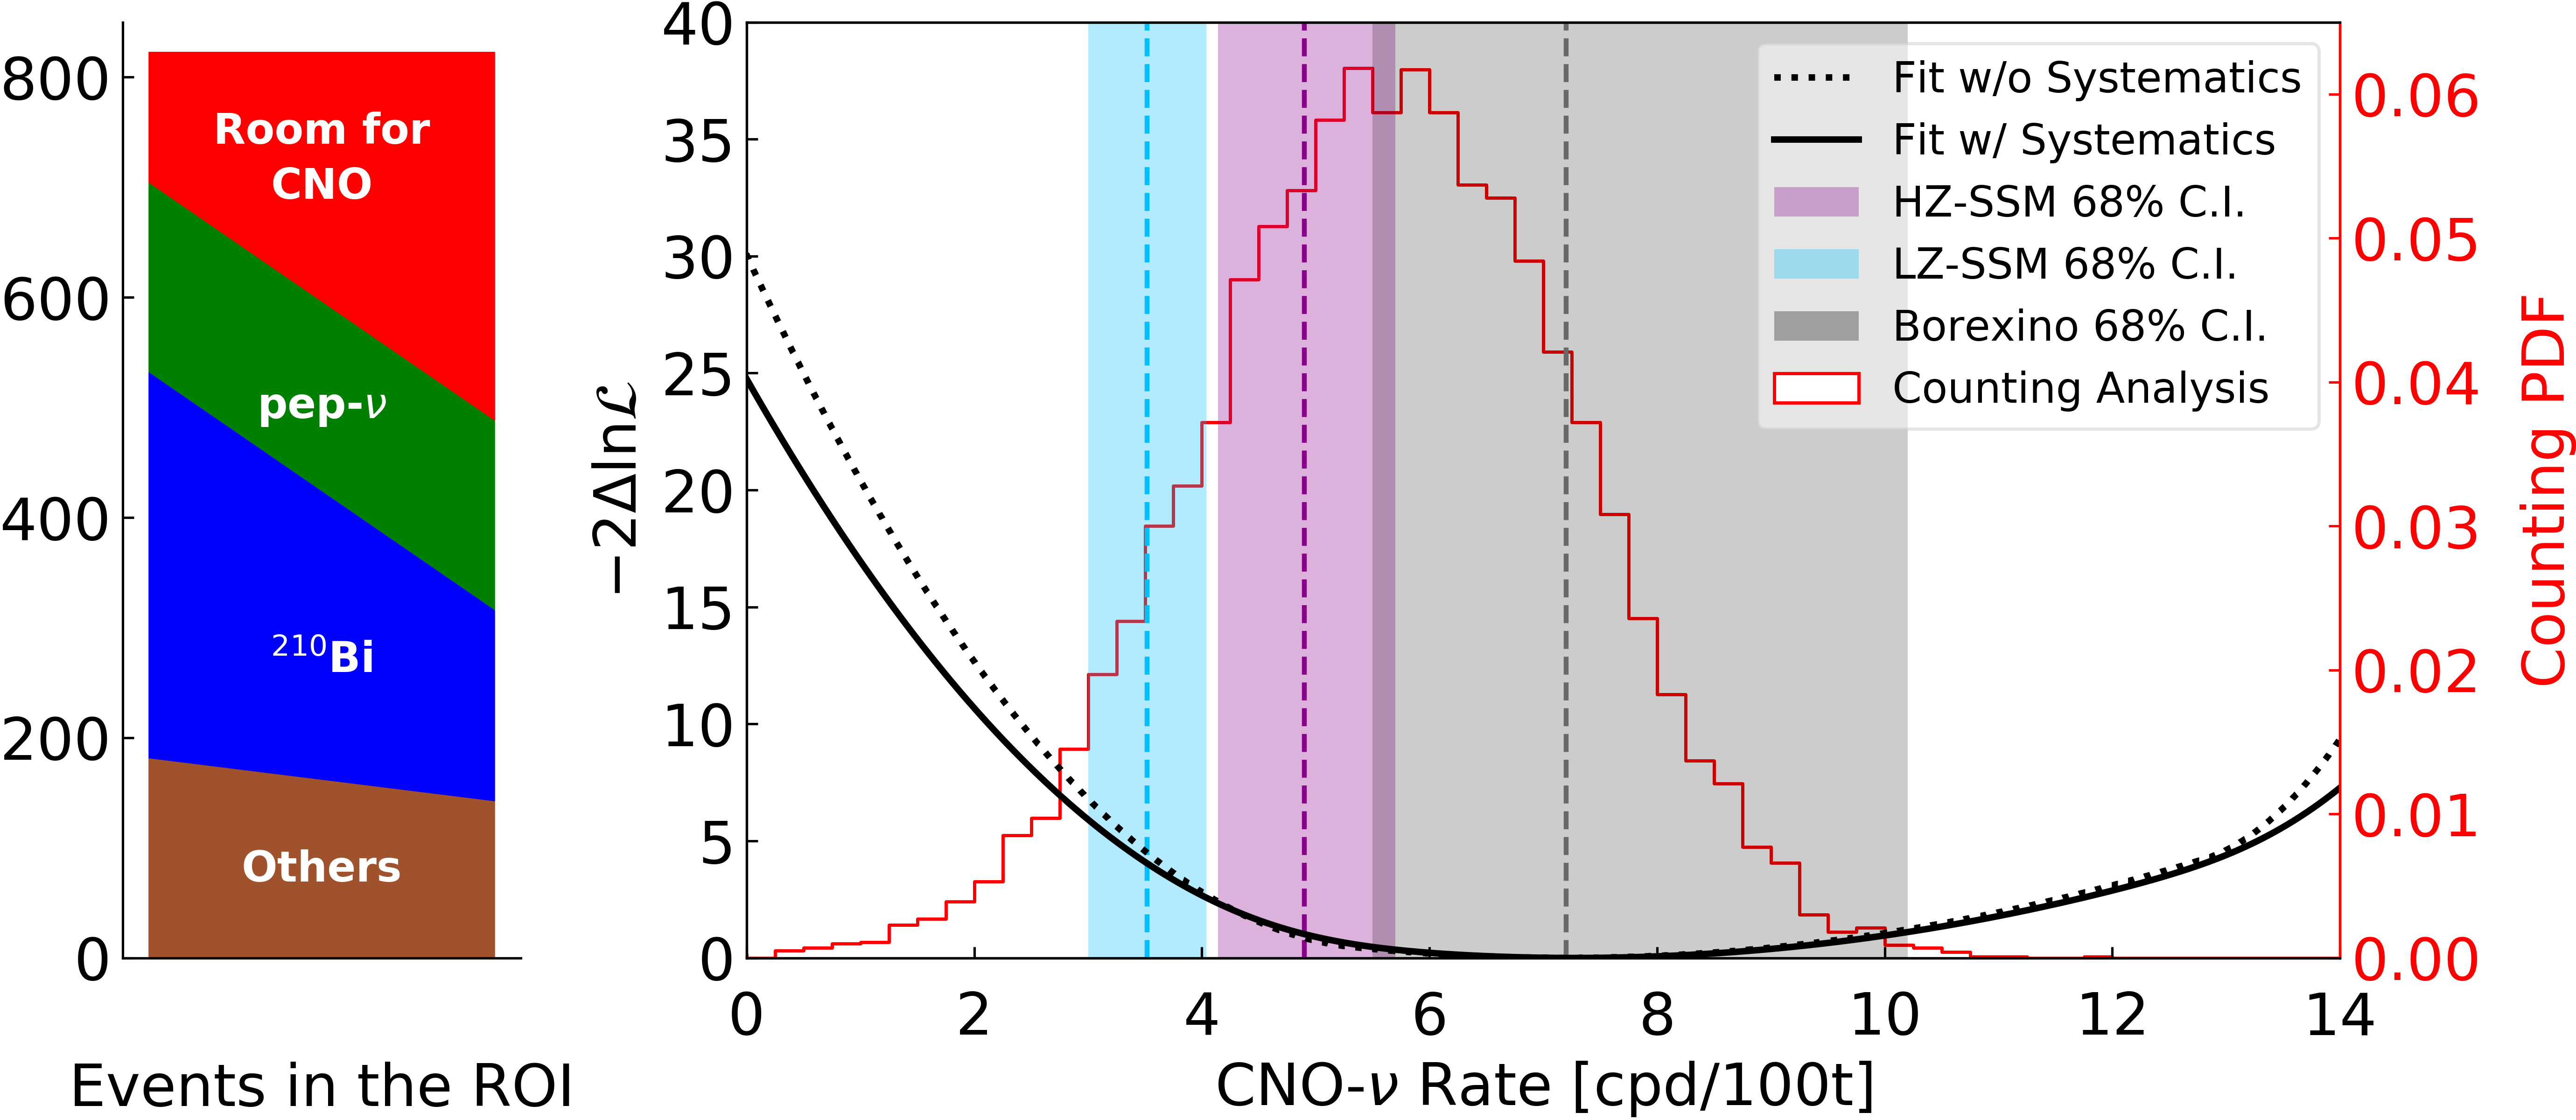
On the left, the counting analysis bar chart: the height represents the number of events allowed by the data for CNO-neutrinos and backgrounds in the region of interest (ROI). The less events in the ROI, the minimum the CNO signal is while backgrounds are maximum; likewise, more events in the ROI, CNO signal is maximum and backgrounds are minimum. It is clear from this figure that the contribution of CNO neutrinos cannot be zero.
On the right, CNO-neutrino rate negative log-likelihood ( ) profile obtained directly from the multivariate fit (dashed black line, available here) and after folding in the systematic uncertainties (black solid line, available here). The histogram in red shows the CNO-neutrino rate (bin property can be found here) obtained from the counting analysis. The blue, violet and grey vertical bands show 68% confidence intervals (CI) for the SSM-LZ (3.52
  0.52 cpd per 100 t) and SSM-HZ (4.92 0.78 cpd per 100 t) predictions (according to N. Vinyoles et al. (2017), M. Agostini et al. (2020) ) and the Borexino result (corresponding to the black solid-line loglikelihood profile), respectively.
In the following plots (as in Figure Extended Data 7 of our article), we present the angular and radial uniformity of the  events in the optimized energy window.
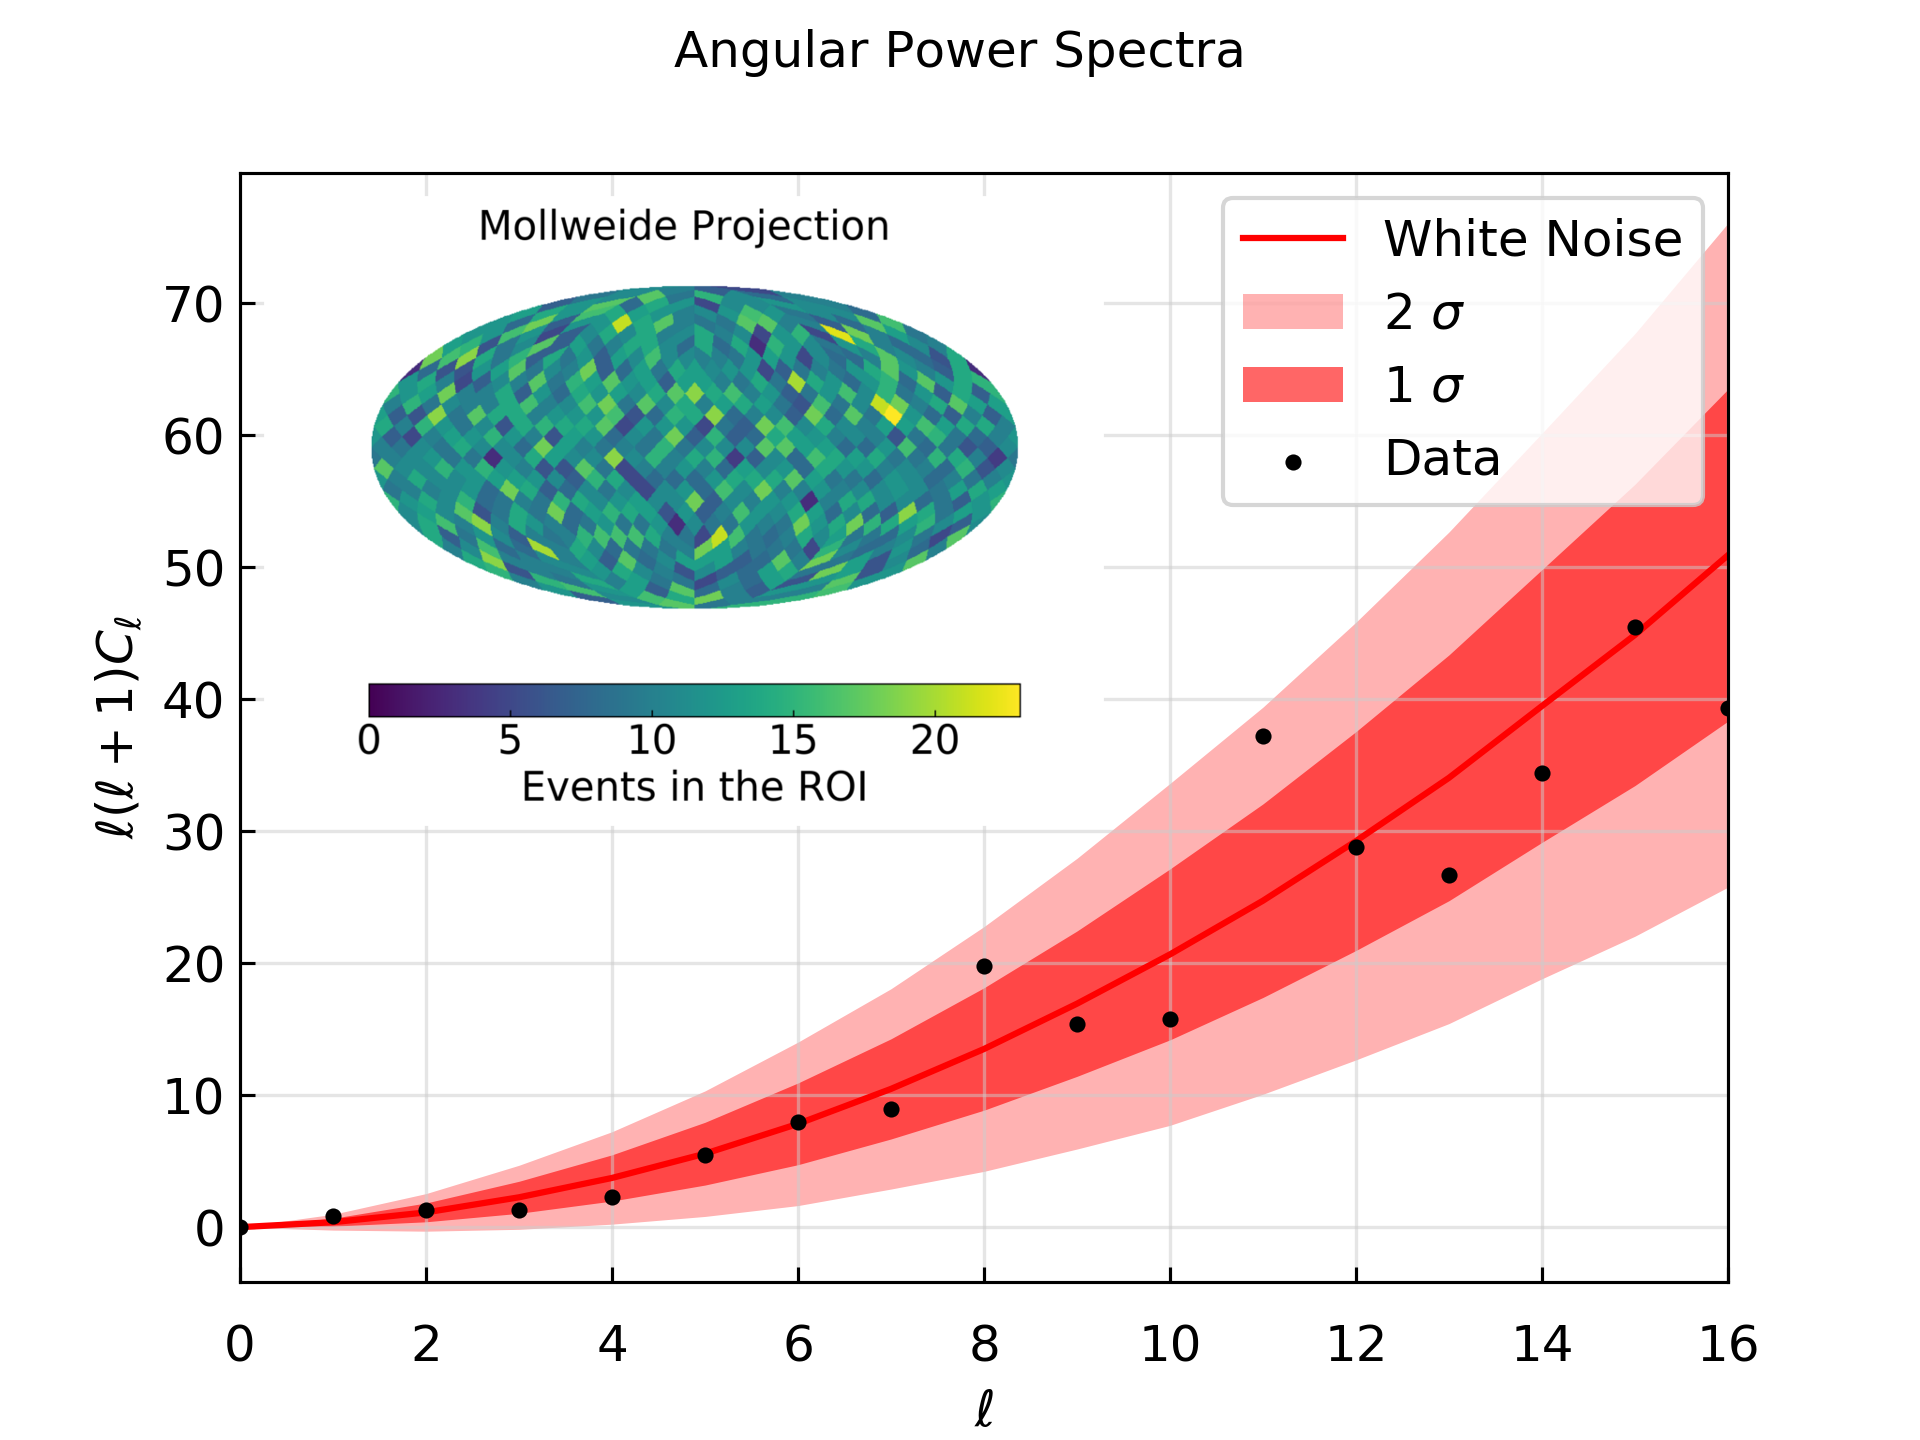
The angular power spectrum as a function of the multipole moment  of observed events (black points, bin properties available here) compared with 10 uniformly distributed events from Monte Carlo simulations at 1 (dark pink) and 2 (pink) confidence levels (C.L.). Data are compatible with a uniform distribution within the uncertainty of 0.59 cpd per 100 t. The inset represents the angular distribution of the events (data available here).
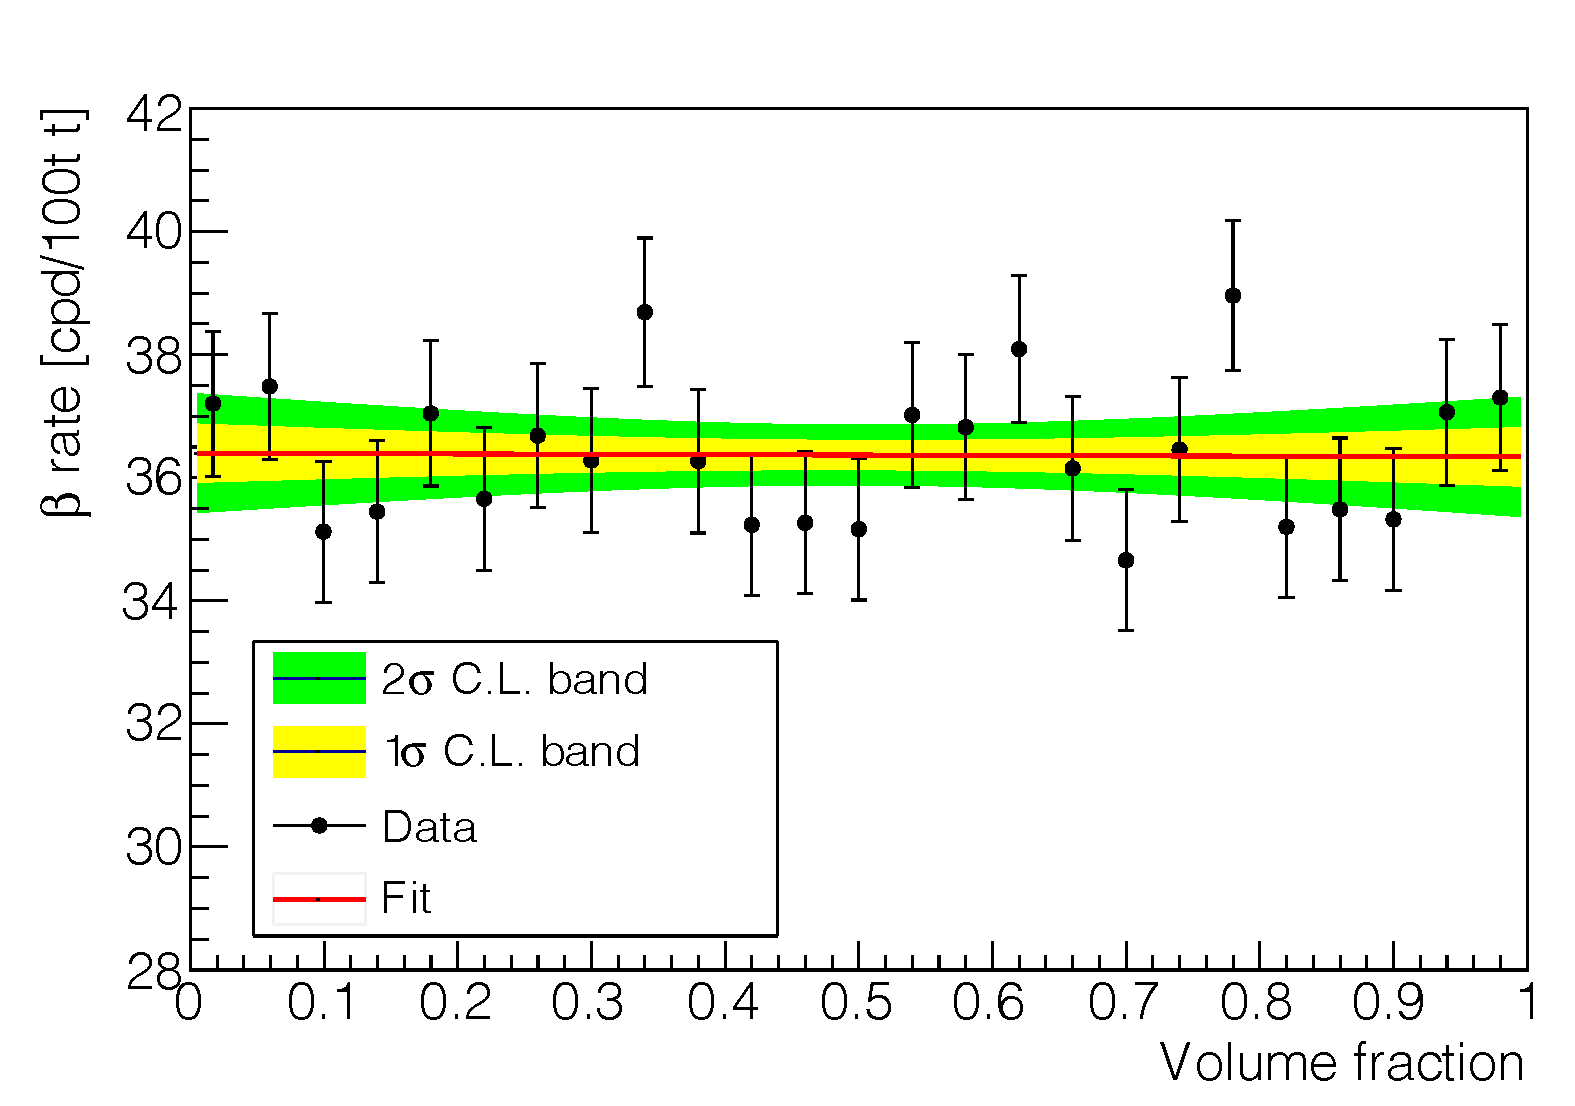
Here above we show the normalized radial distribution of events  (black points, bins properties available here), where r = 2.5 m is the radius of the sphere surrounding the analysis fiducial volume.
The linear fit of the data (red solid line) is shown along with the 1 (yellow) and 2 (green) confidence level bands. The data are compatible with a uniform distribution within 0.52 cpd (counts per day) per 100 t.
Figure Extended data 8 as in our publication shows the energy distributions from a multivariate fit of the Borexino data.
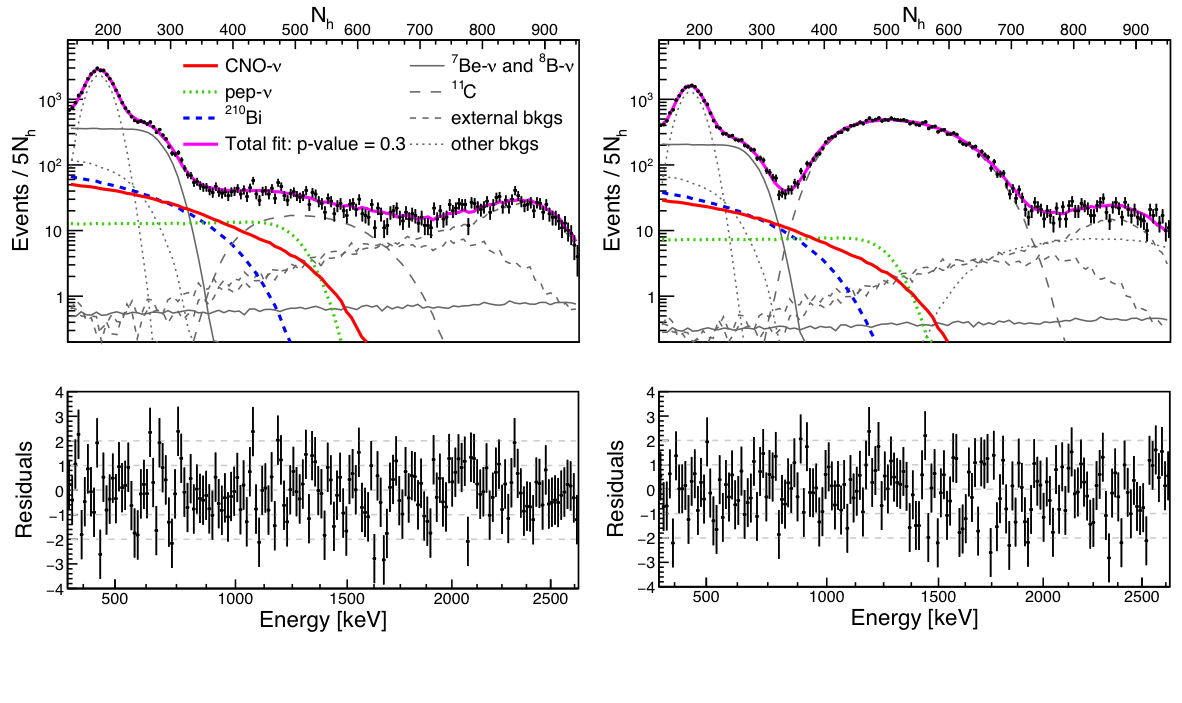
The full multivariate fit results for the Three Fold Coincidence (TFC)-subtracted (left) and the TFC-tagged (right) energy spectra are reported with the corresponding residuals. Data bins content and residuals are available here: TFC-subtracted data, TFC-subtracted residuals, TFC-tagged data, TFC-tagged residuals. In both graphs the magenta lines represent the resulting fit function, the red line is the CNO neutrino electron recoil spectrum, the green dotted line is the pep neutrino electron recoil spectrum, the dashed blue line is the Bi spectrum, and in grey we report the remaining background contributions.
The radial distribution from a multivariate fit of the Borexino data is reported in Figure Extended data 9 of the Borexino publication.
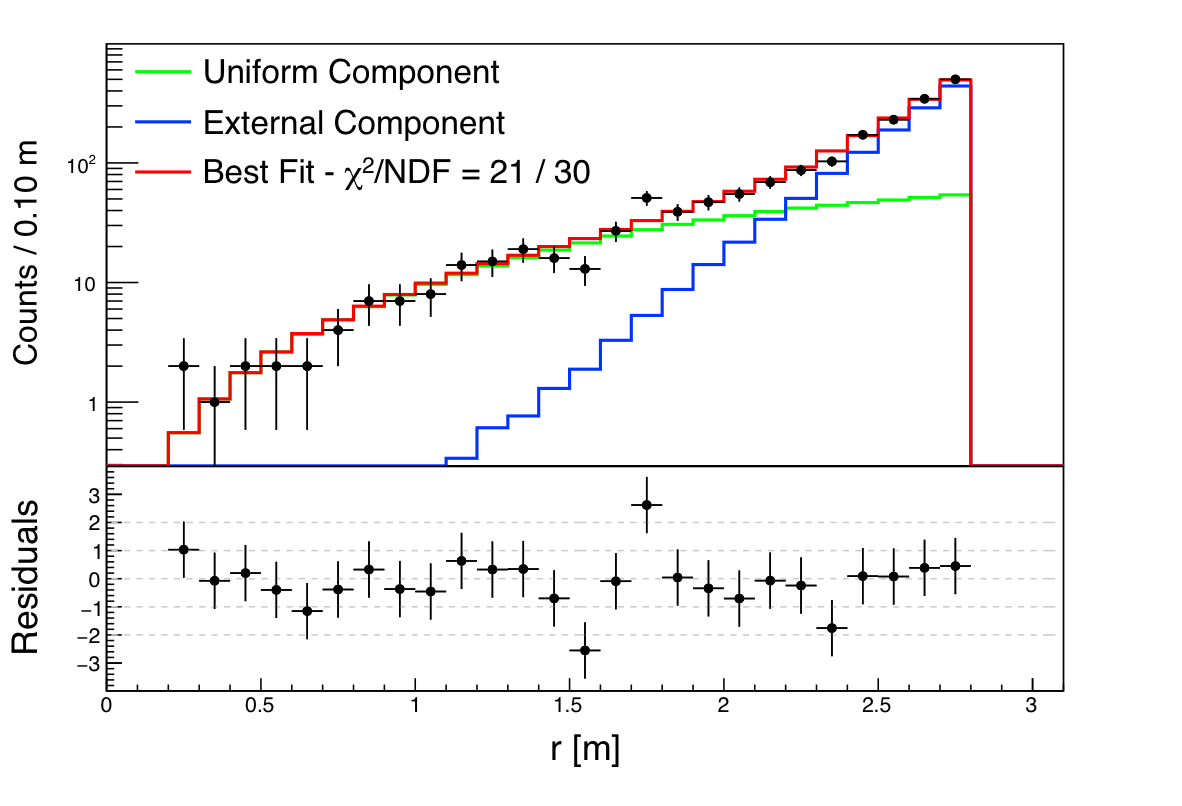 In this plot, the red line is the resulting fit, the green line represents the internal uniform contribution and the blue line shows the non-uniform contribution from the external background. Bins properties of data and residuals are available for download.
Finally, we report in Figure Extended data 10 of the Nature paper a frequentist hypothesis test for our CNO observation.
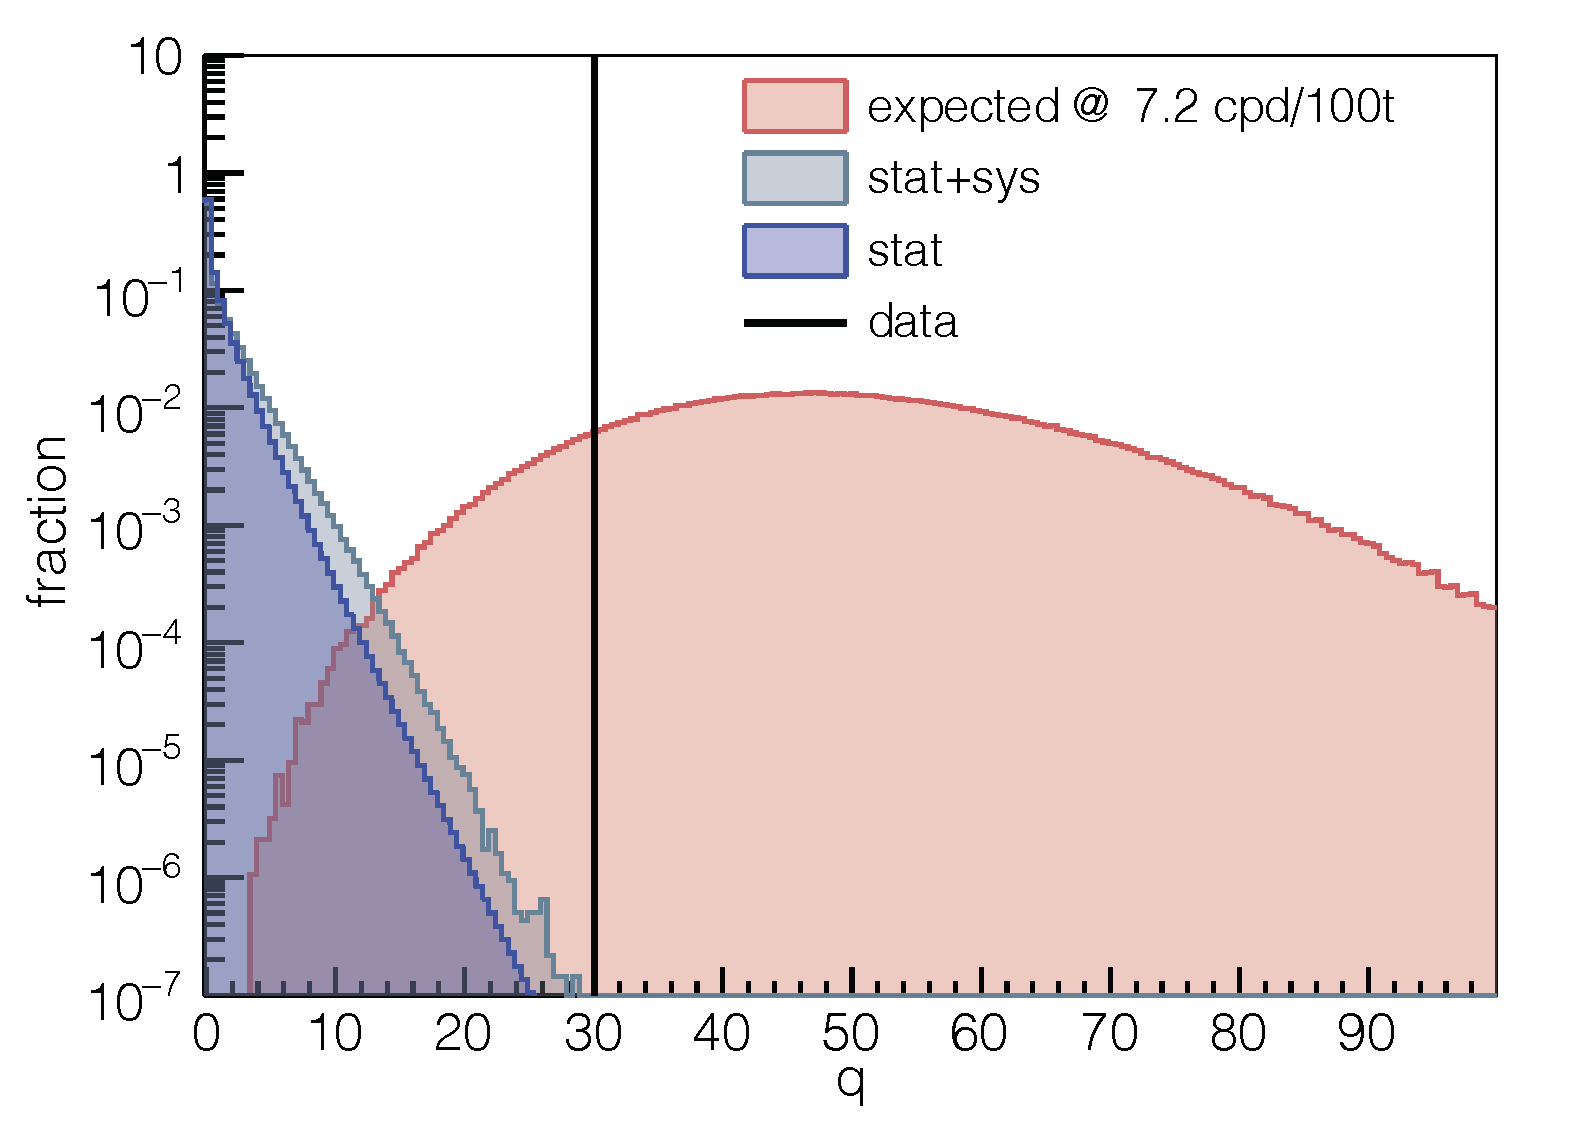
This plot shows the distribution of the test statistics q (defined in Eq. 5 of our paper), obtained from Monte Carlo pseudodatasets.
The grey distribution  results with no CNO simulated data and includes the systematic uncertainty (bin properties available here). The black vertical line represents
  = 30.05. The corresponding P value of with respect to gives the significance of the CNO discovery (>5.0 at 99% C.L.). For comparison, in blue is the without the systematics. The red histogram represents the expected test statistics distribution (bin properties available here) for an injected CNO rate equal to 7.2 cpd (counts per day) per 100 t that is, our best fit value.
Pingback:Borexino awarded the EPS 2021 Giuseppe and Vanna Cocconi Prize – Borexino Experiment