Table of Contents Show
 Seasonal modulation of the 7Be solar neutrino rate in Borexino
Astroparticle Physics, Volume 92, June 2017, Pages 21-29,
ISSN 0927-6505 – Published 26 April 2017
Data availability
The datasets generated during the current study are freely available (see below). Additional information is available from the Borexino Collaboration spokesperson (spokesperson-borex@lngs.infn.it) upon reasonable request.
Abstract
We present the evidence for the seasonal modulation of the 7Be neutrino interaction rate with the Borexino detector at the Laboratori Nazionali del Gran Sasso in Italy. The period, amplitude, and phase of the observed time evolution of the signal are consistent with its solar origin, and the absence of an annual modulation is rejected at 99.99% C.L. The data are analyzed using three methods: the analytical fit to event rate, the Lomb-Scargle and the Empirical Mode Decomposition techniques, which all yield results in excellent agreement.
Open Data
On June 2017, the Borexino collaboration published [Astroparticle Physics 92 (2017) 21-29] an improved measurement of time periodicities of the 7Be solar neutrino interaction rate.
This yearly modulation was observed on 4 years (December 2011 – December 2015) of Borexino Phase II data.
The period, amplitude, and phase of the observed time evolution of the signal are consistent with its solar origin, and the absence of an annual modulation is rejected at 99.99% C.L.
The data were analyzed using three methods:
- the sinusoidal fit;
- the Lomb-Scargle method;
- the Empirical Mode Decomposition techniques.
All the analysis methods clearly confirm the presence of an annual modulation of the 7Be solar neutrino interaction rate and show no signs of other periodic time variations.
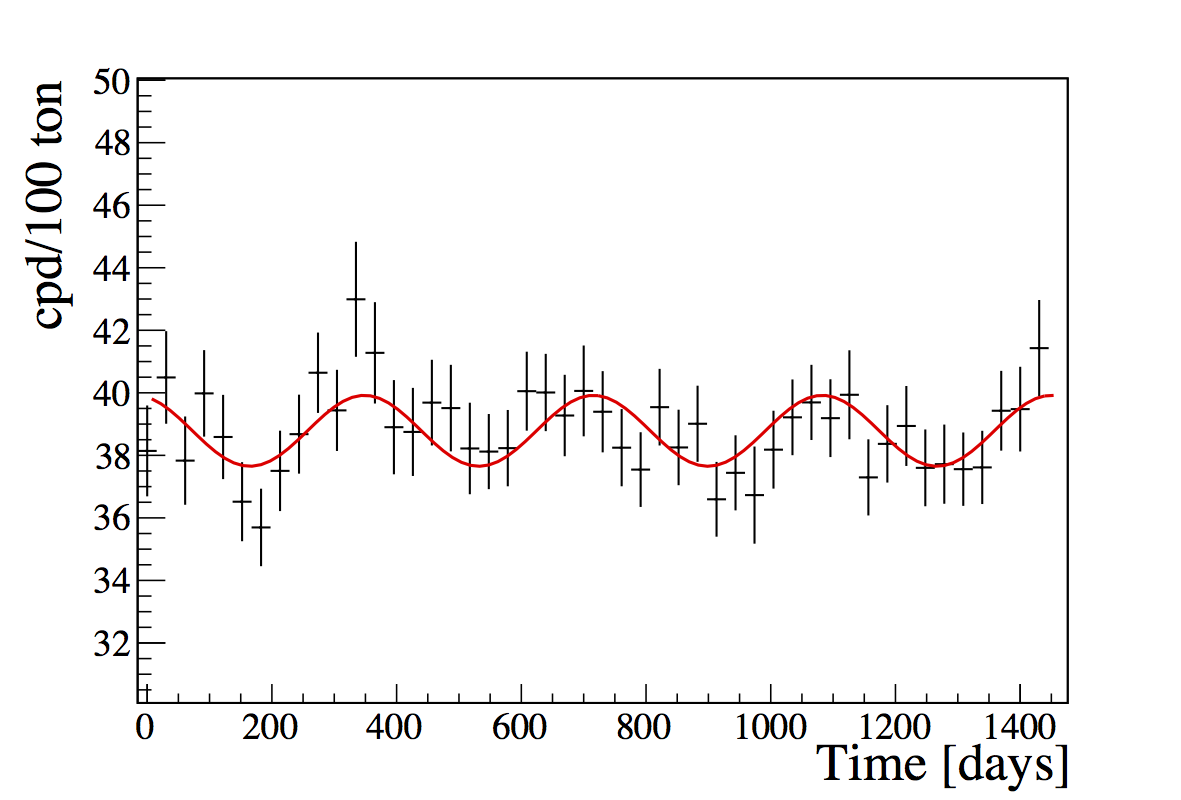
This plot (as given in Fig.4 of our paper) shows the ![]() -like event rate [cpd/100 ton] along with the best fit in 30.4-days long bins, starting from Dec 11, 2011 . The red line describes the analytical fit equation:
-like event rate [cpd/100 ton] along with the best fit in 30.4-days long bins, starting from Dec 11, 2011 . The red line describes the analytical fit equation:
![]()
Related data (Nbin, rate and errors) are available here.
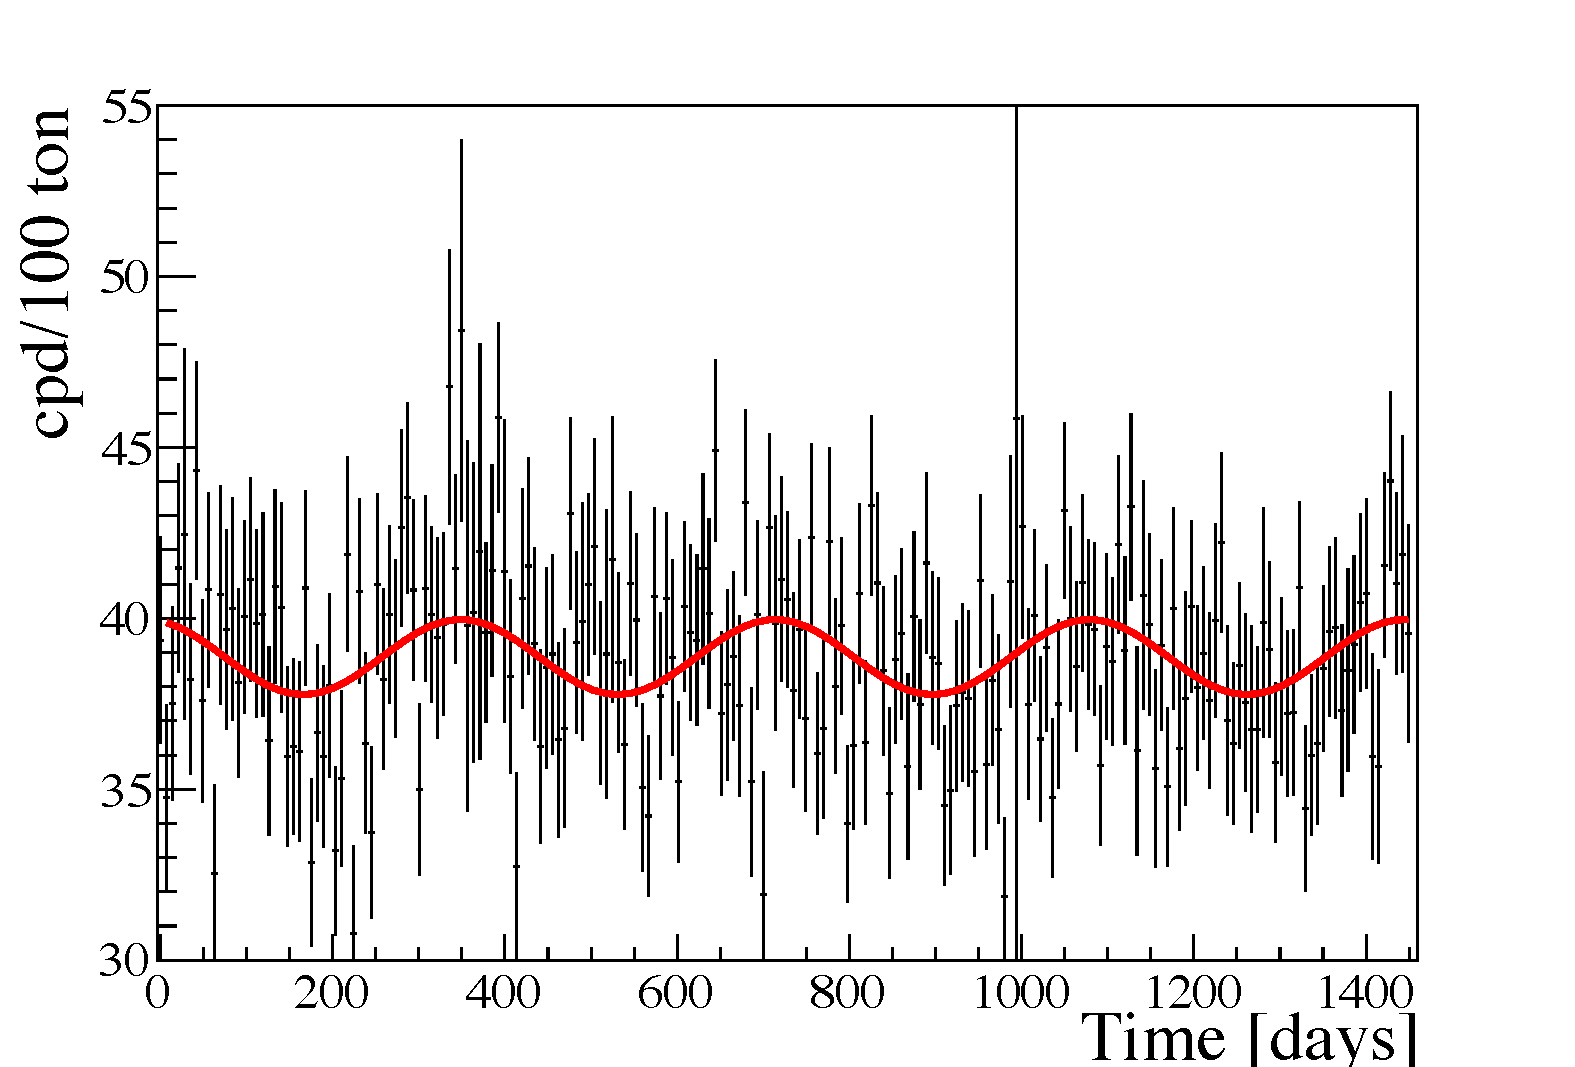
The robustness of the fit was studied by varying the bin size and the fitting methods. The following plot (as given in Fig. 5 of the publication) shows the rate of ![]() -like events passing selection cuts in 7-days long bins. This time, the red line is the best fit resulting from the Lomb-Scargle analysis. Associated data (Nbin, rate and errors) can be found here.
-like events passing selection cuts in 7-days long bins. This time, the red line is the best fit resulting from the Lomb-Scargle analysis. Associated data (Nbin, rate and errors) can be found here.

