Table of Contents Show
 Independent determination of the Earth’s orbital parameters with solar neutrinos in Borexino
Astroparticle Physics
Volume 145, March 2023, 102778
ISSN 0927-6505
Data availability
The datasets generated during the current study are freely available: see below (scroll down). Additional information is available from the Borexino Collaboration spokesperson (spokesperson-borex@lngs.infn.it) upon reasonable request.
Abstract
Since the beginning of 2012, the Borexino collaboration has been reporting precision measurements of the solar neutrino fluxes, emitted in the proton–proton chain and in the Carbon–Nitrogen–Oxygen cycle. The experimental sensitivity achieved in Phase-II and Phase-III of the Borexino data taking made it possible to detect the annual modulation of the solar neutrino interaction rate due to the eccentricity of Earth’s orbit, with a statistical significance greater than 5. This is the first precise measurement of the Earth’s orbital parameters based solely on solar neutrinos and an additional signature of the solar origin of the Borexino signal. The complete periodogram of the time series of the Borexino solar neutrino detection rate is also reported, exploring frequencies between one cycle/year and one cycle/day. No other significant modulation frequencies are found. The present results were uniquely made possible by Borexino’s decade-long high-precision solar neutrino detection.
Open Data
The Borexino experiment concluded its data taking in October 2021 after more than 14 years of activity. The time series of the total solar neutrino rate over the last 10 years was analyzed using events selected in a fixed energy window chosen to maximize the signal-to-background ratio. We have searched for solar neutrino signal modulations in the frequency range between one cycle/year and one cycle/day using the generalized Lomb-Scargle method.
We identified no significant periodic signal other than the annual modulation due to the Earth’s orbit eccentricity. The latter is measured with amplitude (related to the orbit eccentricity), phase (perihelion position), and frequency (Earth revolution) parameters compatible within one sigma with astronomical predictions.
In particular, the best-fit eccentricity is  = 0.0184 ± 0.0032 (stat + sys), with the null hypothesis excluded with a significance greater than 5
 .
.
This result is the most precise measurement of the Earth’s orbit eccentricity obtained using solar neutrinos alone. No other significant modulation of the backgrounds is expected in the selected energy range.
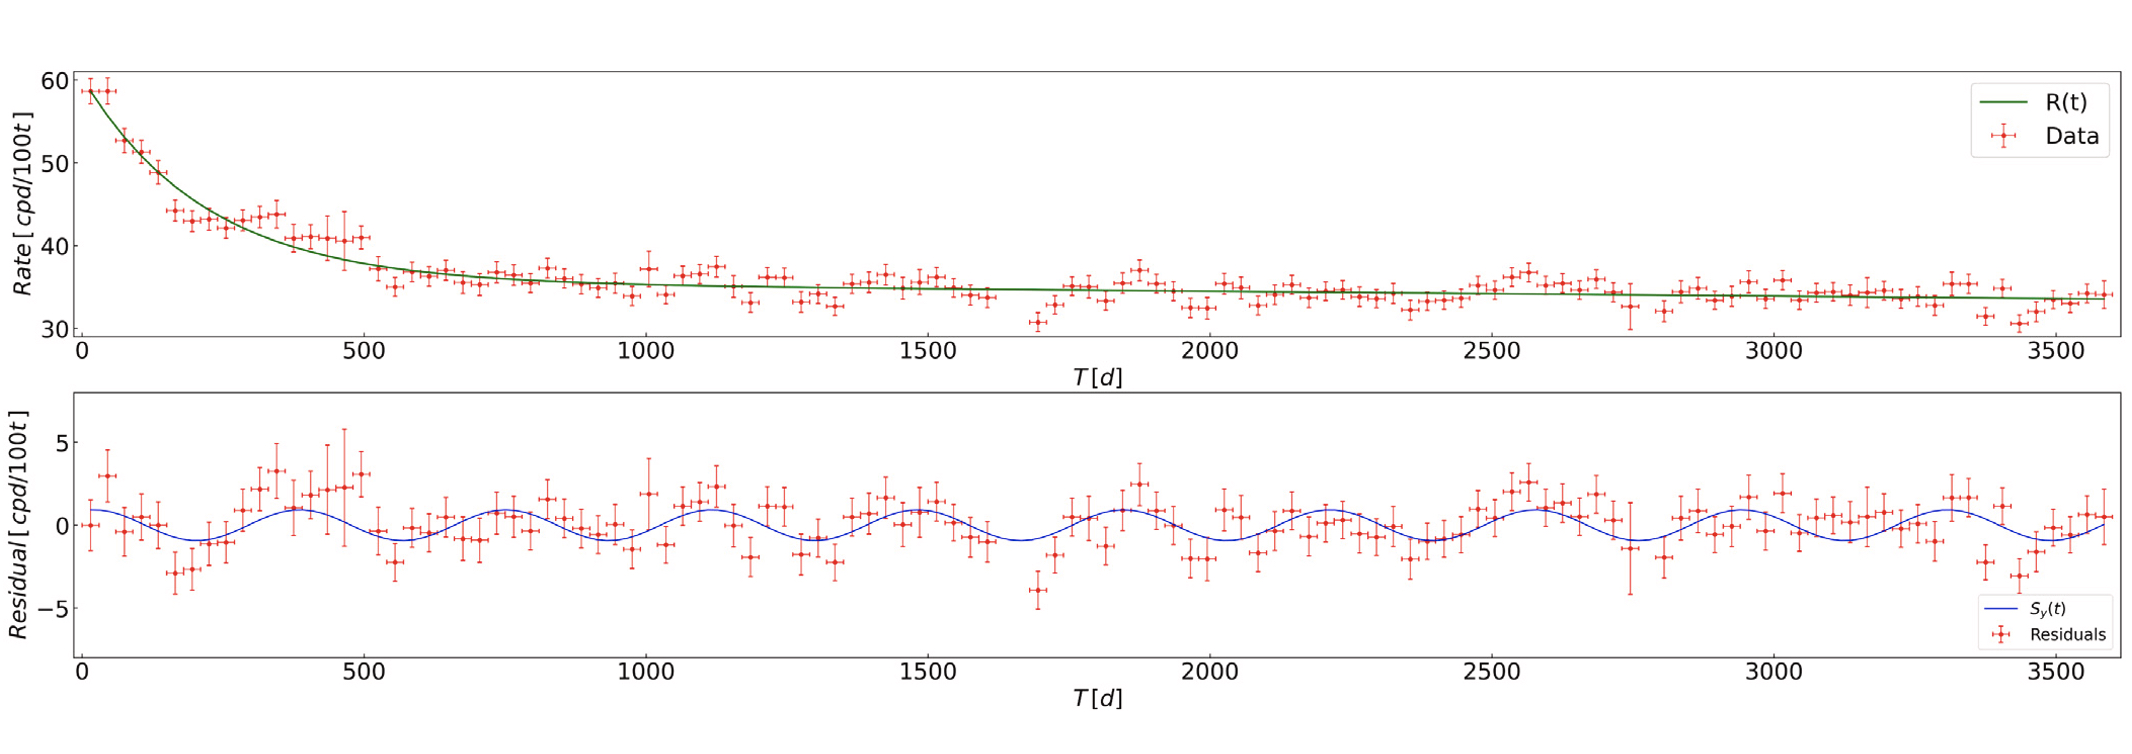
In the plots above (Fig. 4 of our paper), we show the full Borexino rate time series (Phase-II and Phase-III) in the RoI fitted to the trend model R(t) to remove secular components and the relative residuals with respect to the trend model R(t) (green line). The rate in cpd/100 t is binned in time intervals of 30 days. The time axis is reported in days since 12:00 AM of December 11th 2011, in UTC time. For each bin, the Time bin center, the bin content and its error as well as the trend value are available here.
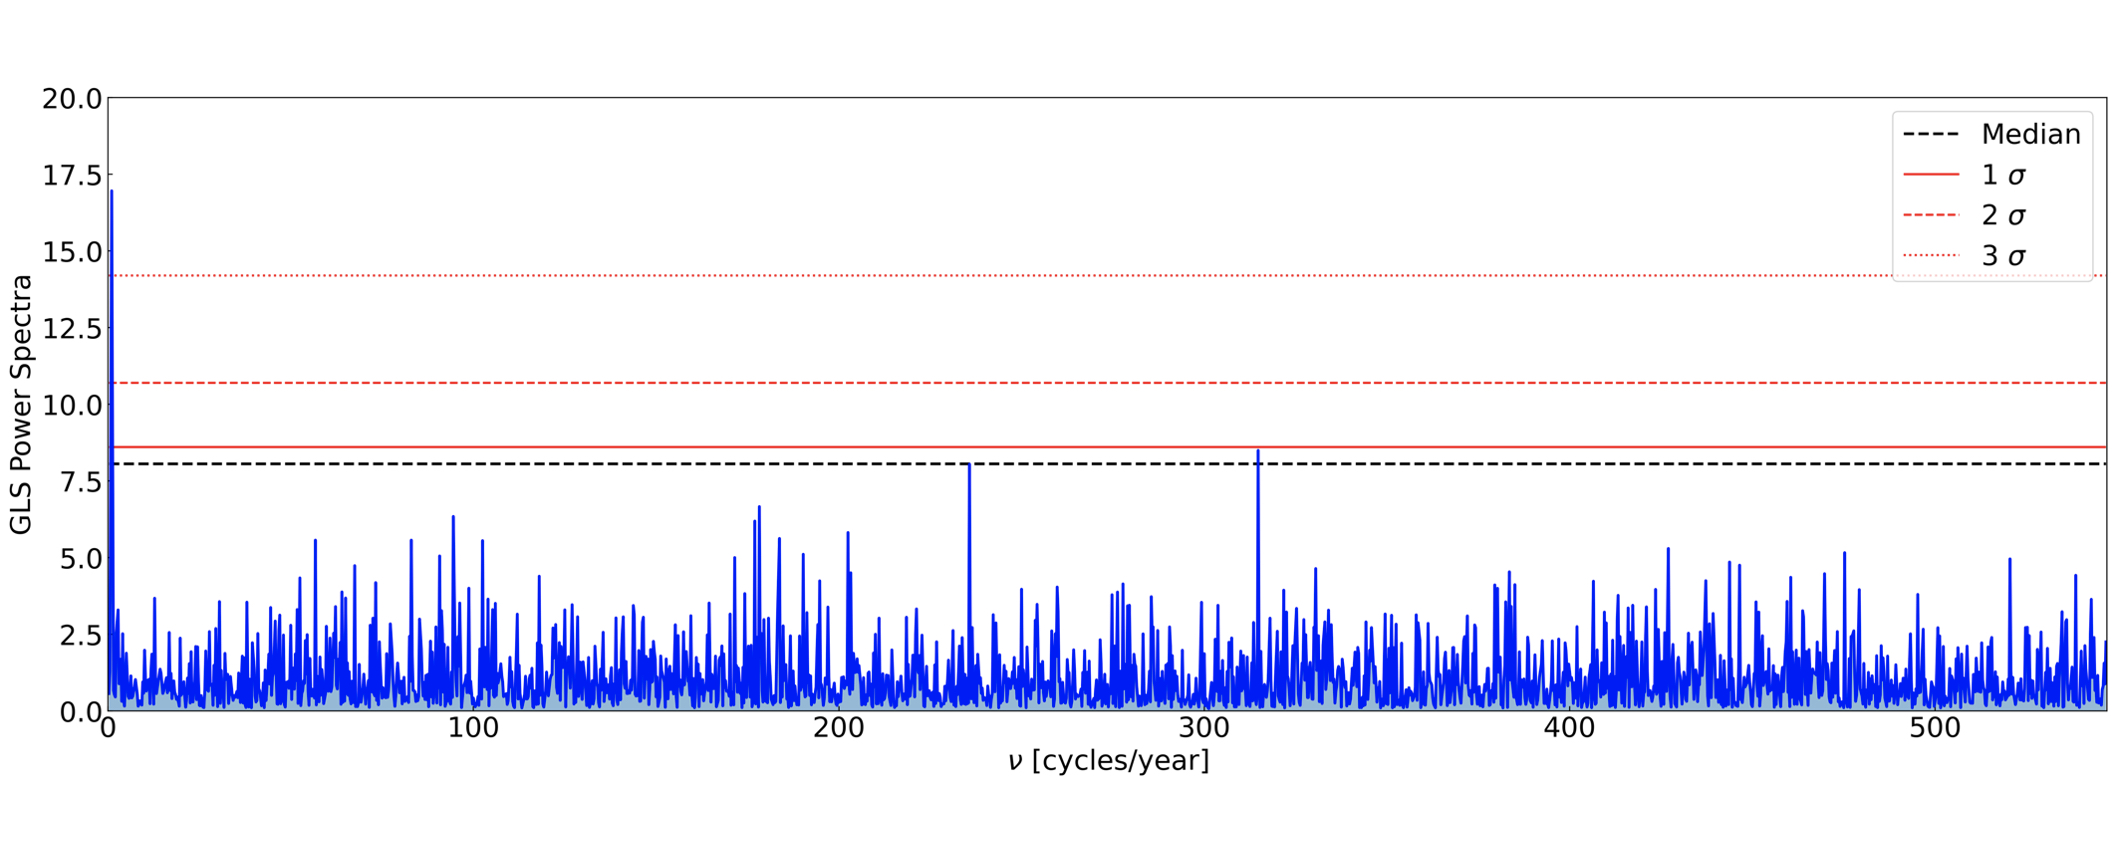
The blue sinusoidal best fit of the residual rate (bottom plot) confirms the presence of a significant annually modulated signal. In fact, a clear peak at one cycle/year frequency emerges from the full periodogram reported in Fig. 5 (see below) of our paper where we show the GLS power spectrum in  units of the residual rate (bottom plot of Fig. 4). Frequencies as cycles/year and the GLS Power Spectrum are available here.
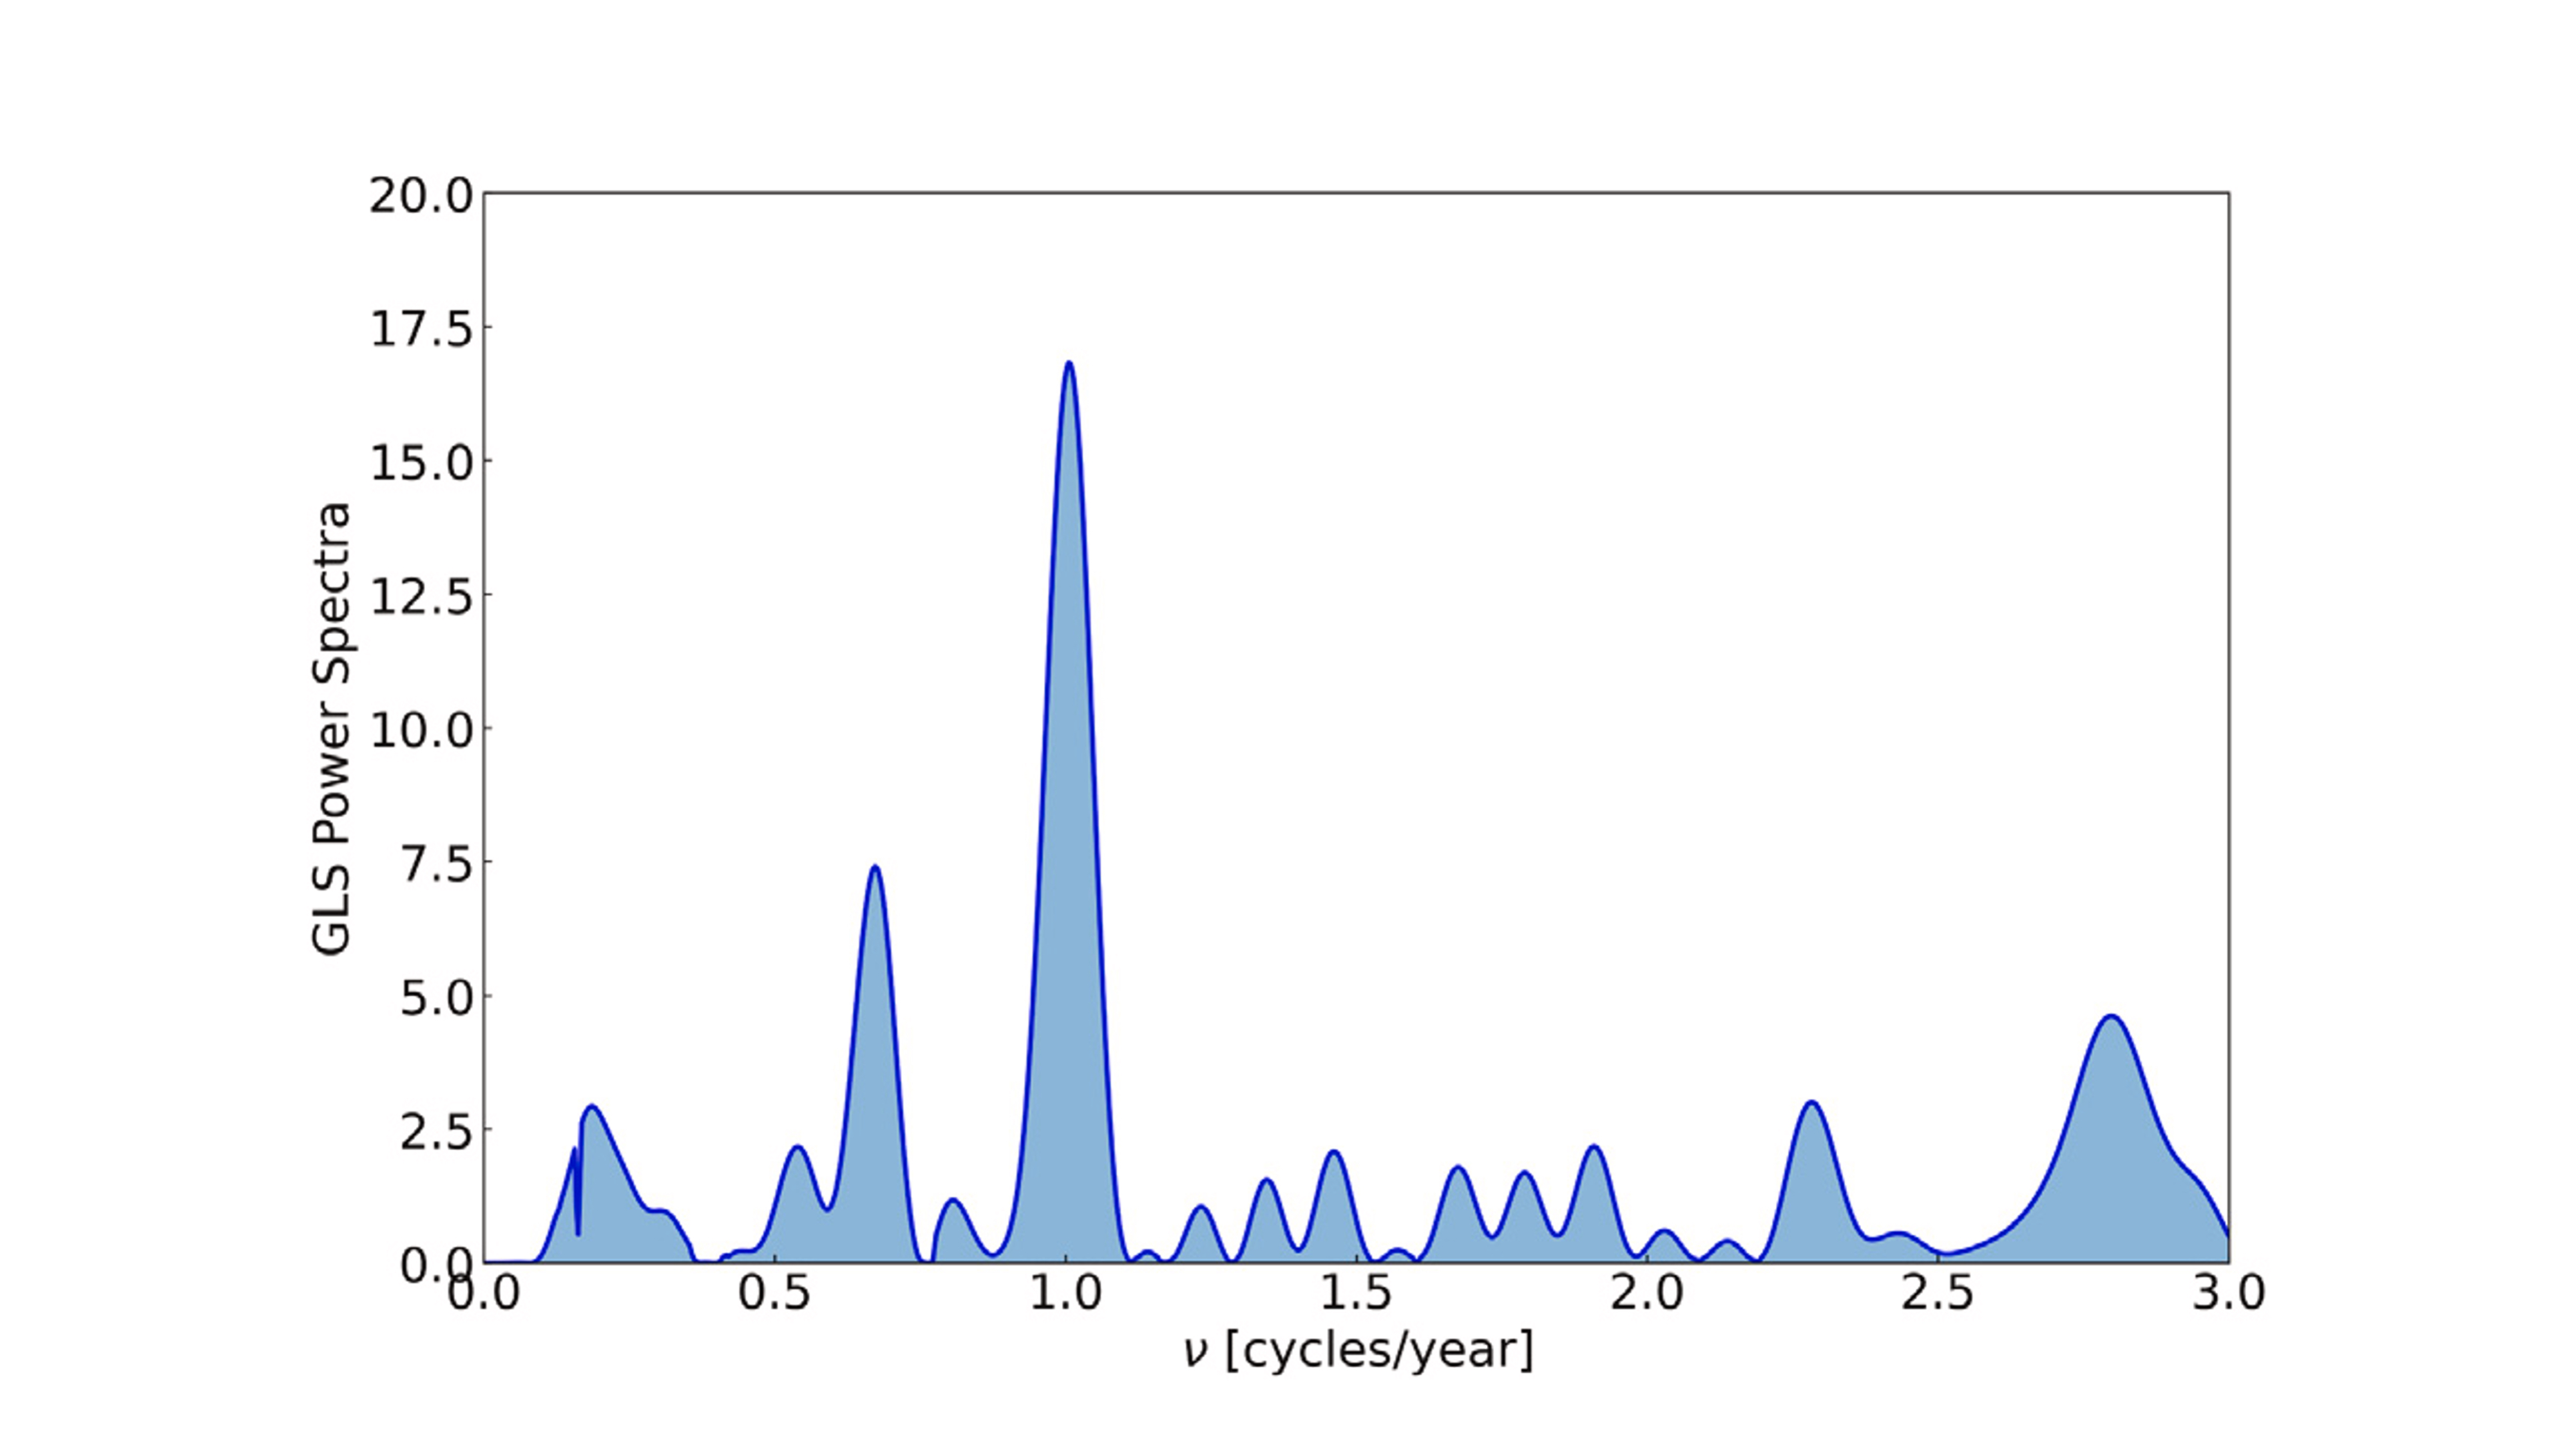
Figure 8 of our our paper shows the full Borexino rate time series (Phase-II and Phase-III) in the RoI, fitted to the trend model R(t) to remove the secular components (top plot, data available here). The rate in cpd/100t is binned in time intervals of 8 h. The bottom plot of Fig. 8 depicts the residuals of the time series with respect to the trend model. The blue curve shows the sinusoidal fit of the residual rate, indicating the presence of a significant annual modulation signal.
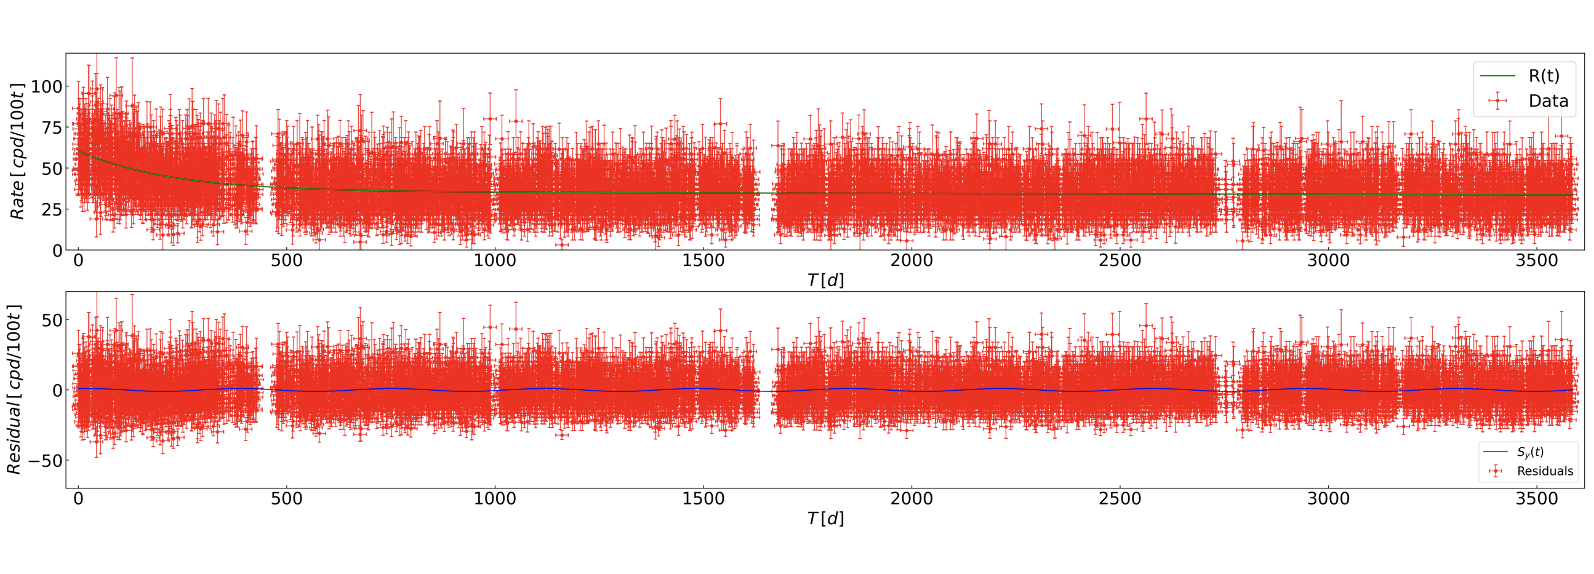
Figure 9 of our paper reports about the GLS power spectrum in units units of the residual rate of Fig. 8 bottom. Frequencies are reported in cycles/year and the bin content of this plot can be downloaded here. The median significance threshold from LEE is shown by a horizontal black dashed line, along with 1, 2, and 3 significance levels (solid, dashed and dotted red lines, respectively). No significant peaks besides the annual modulation are present above random fluctuations of the statistical Poissonian noise.
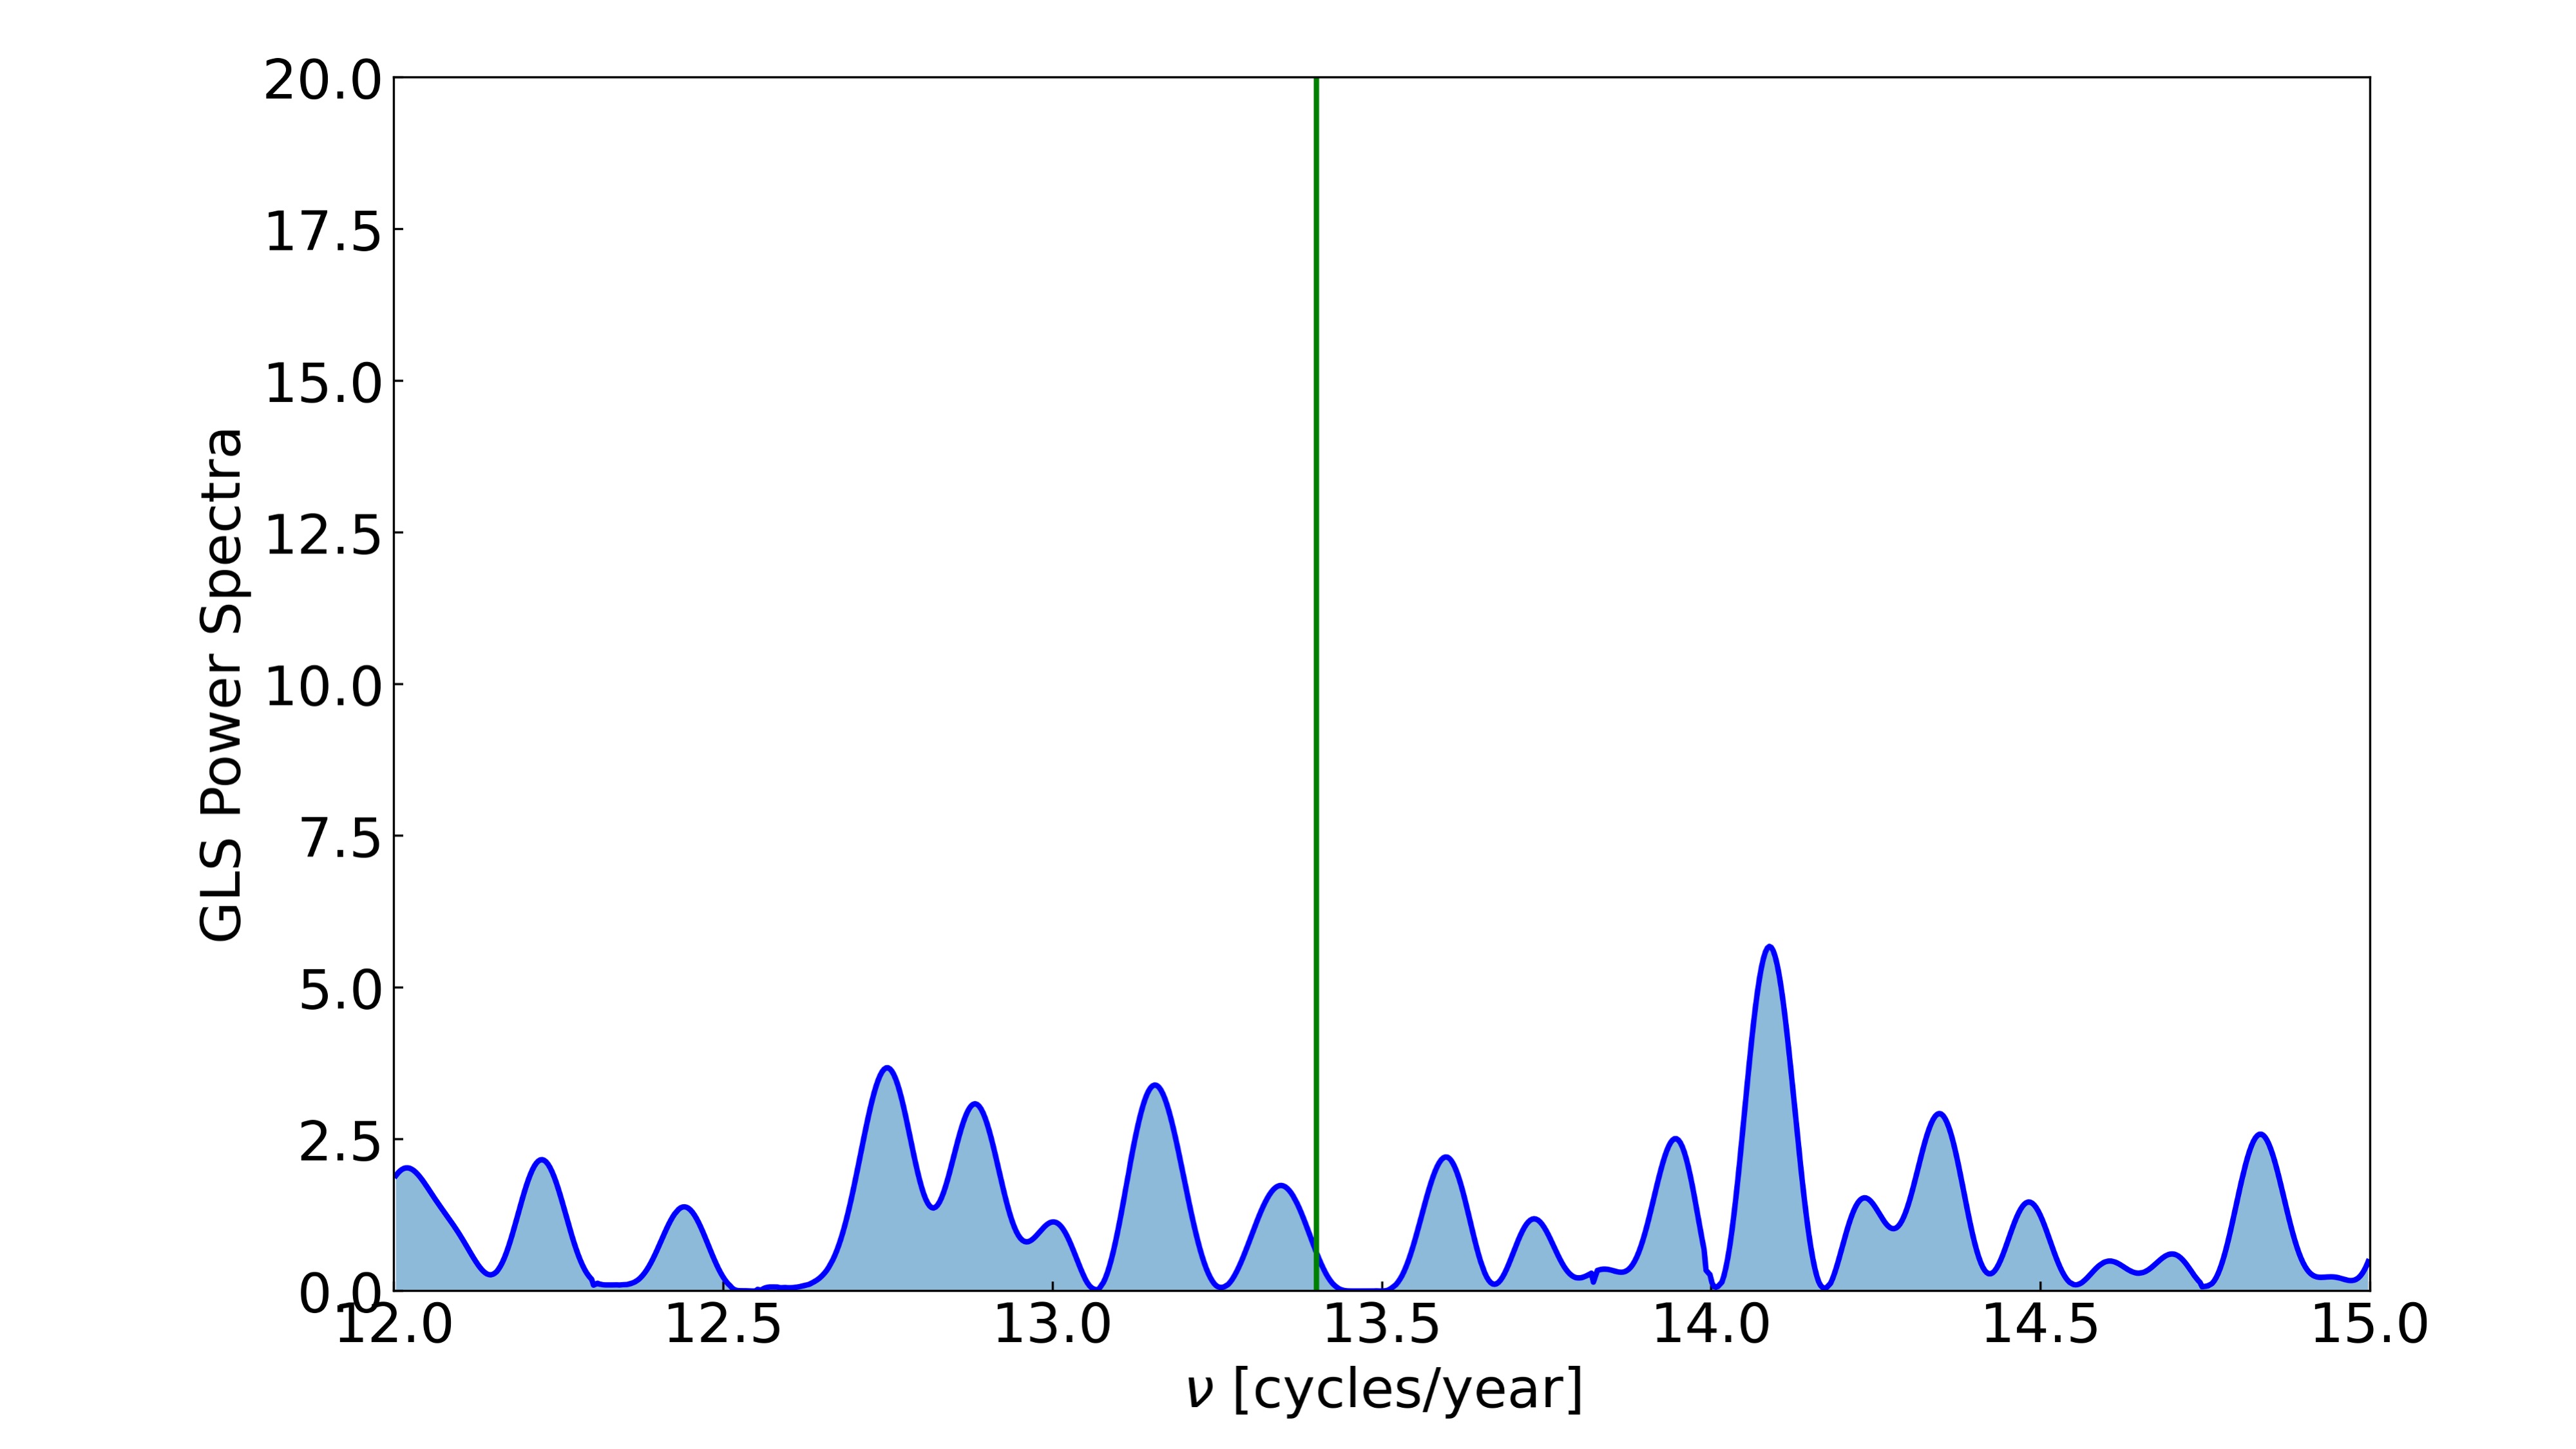
Finally, the two plots of Fig. 10 in our paper show on top a zoom-in of the GLS power spectrum (in arbitrary units) of the residual rate of Fig. 8 around the one cycle/month point (data available here). The Sun’s synodic rotation line of 13.4 cycles/year is also shown (green vertical line).
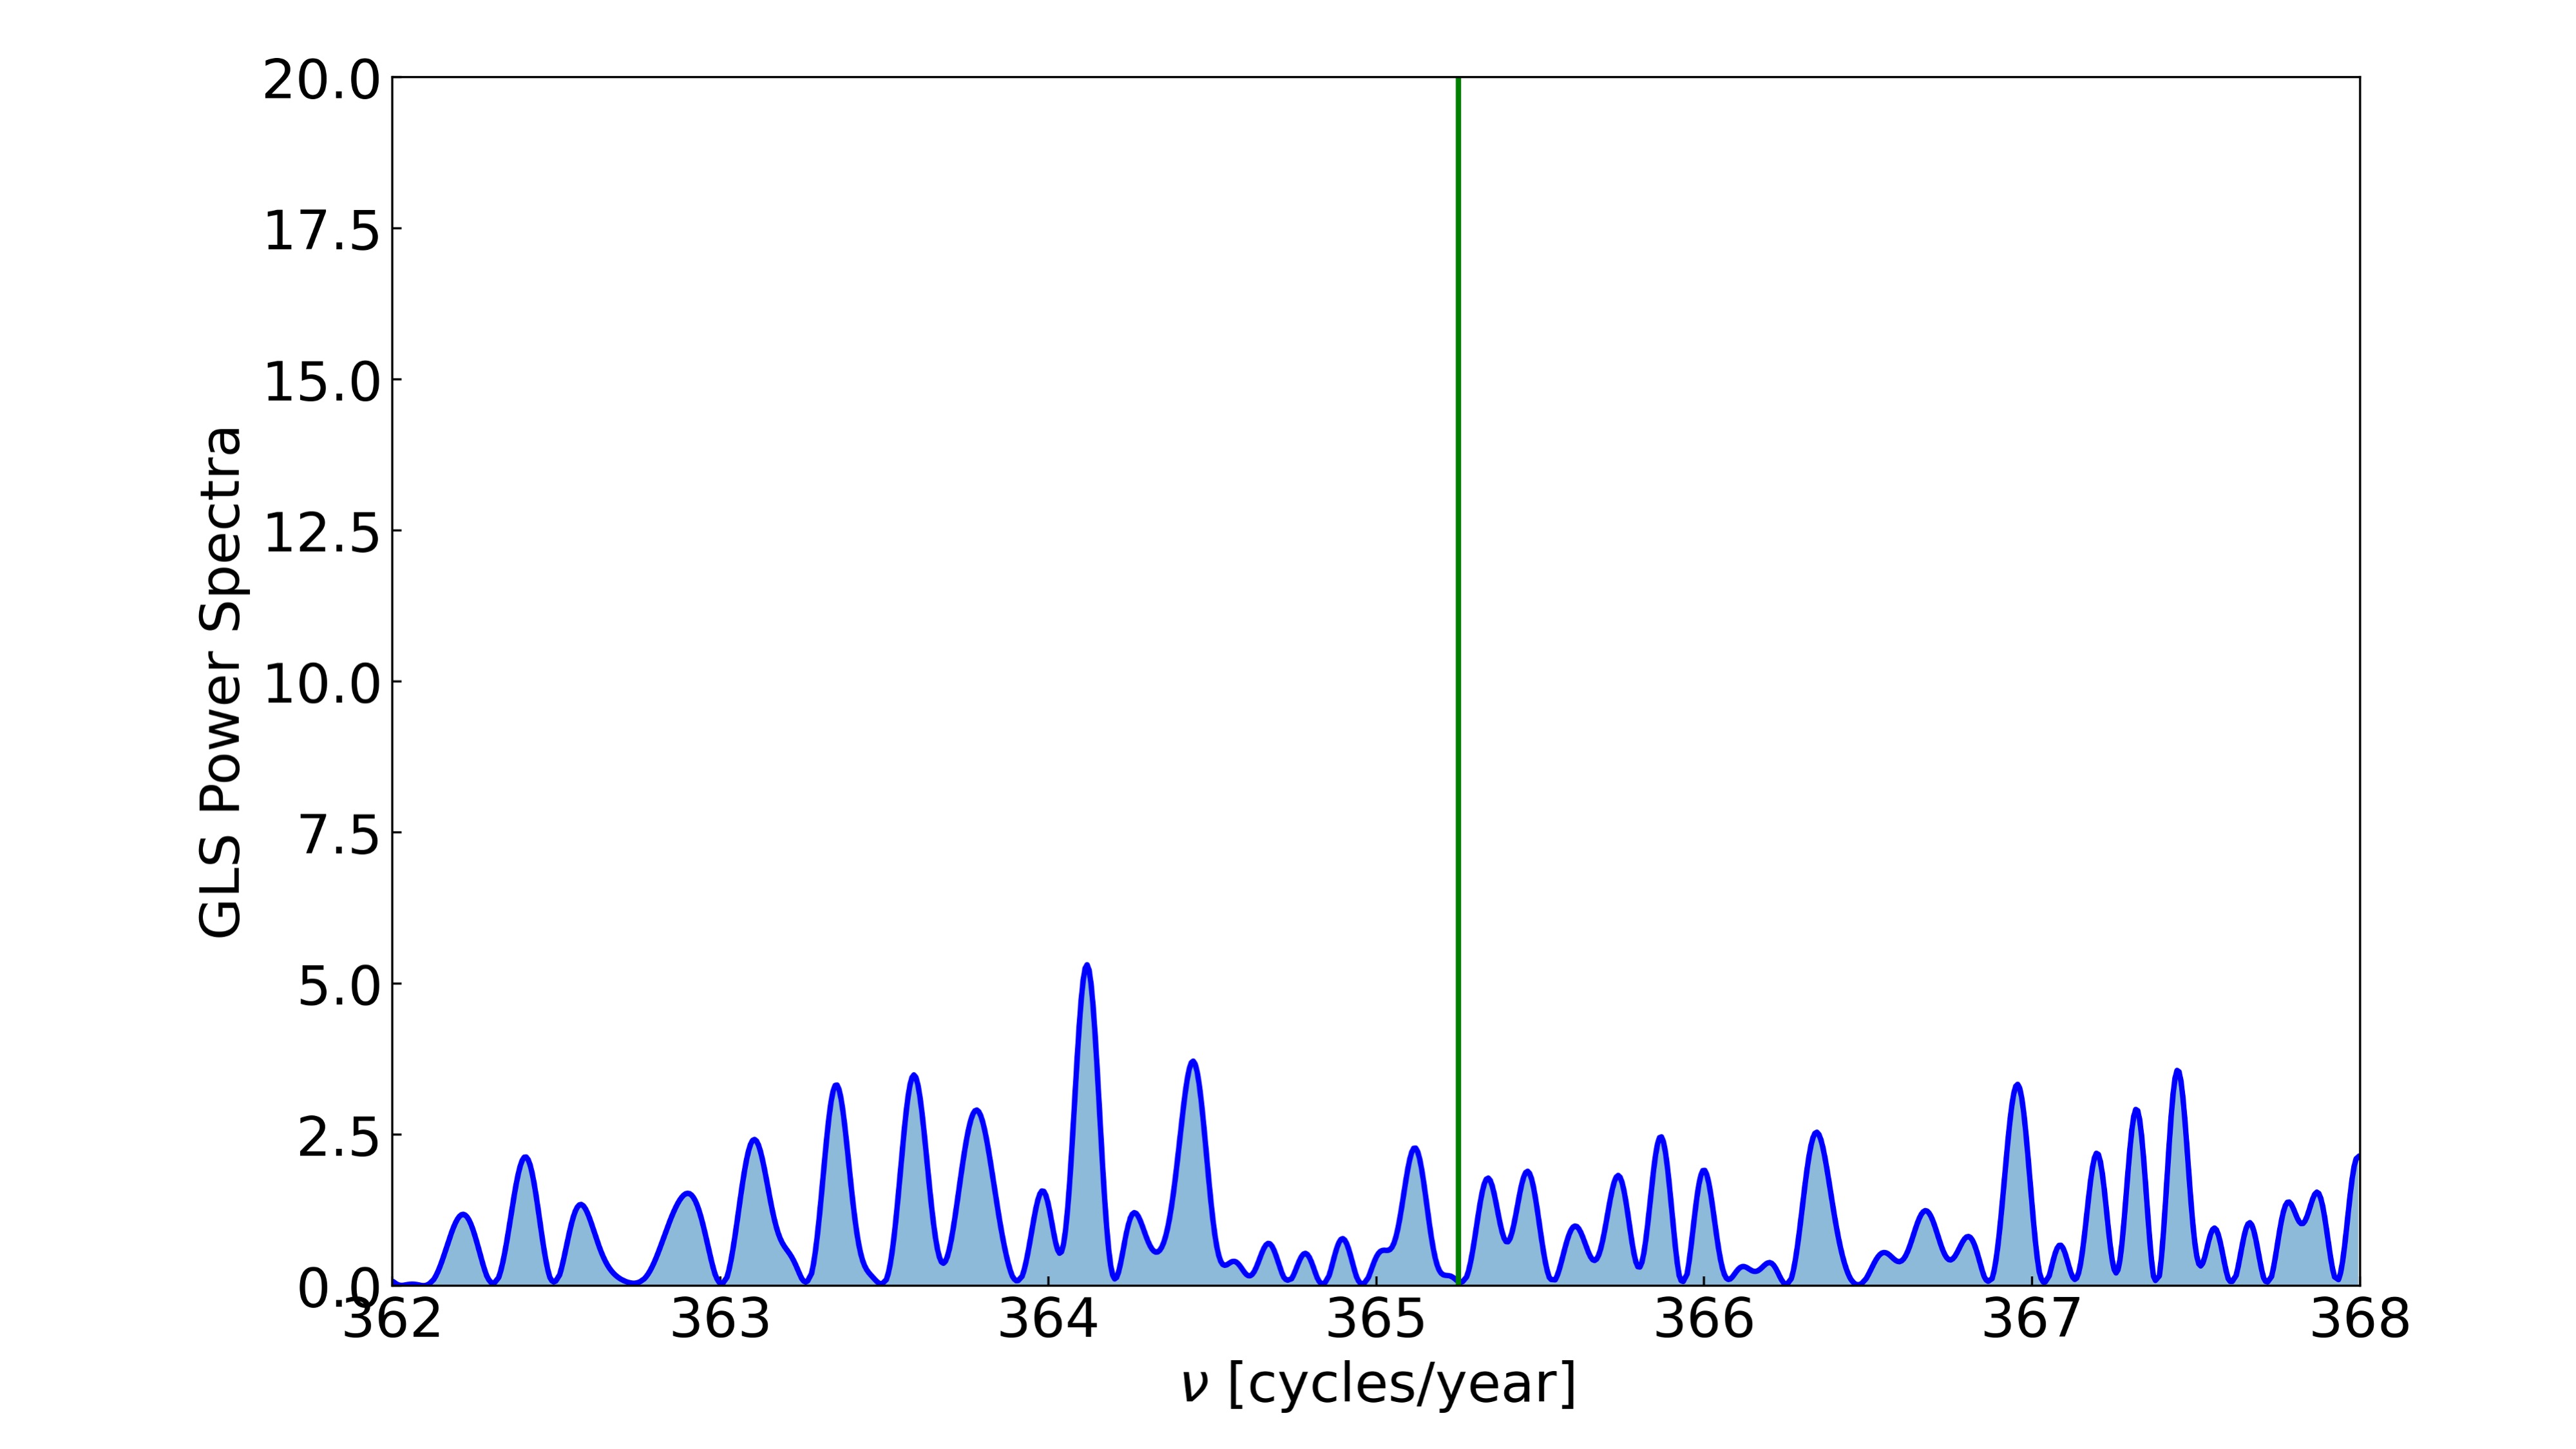
In the bottom plot of Fig. 10 of our paper, we show a zoom-in of GLS power spectrum (in arbitrary units) of the residual rate of Fig. 8 around the one cycle/day point (data available here). The Earth’s rotation line of 365.2596 cycles/year is shown (green vertical line).